
| A Plea |
The climate crisis is an existential threat to all of us and the greatest challenge humanity faces – from extreme weathers to entire regions becoming inhospitable. The effects can already be felt around the world, whether it be droughts in the US or floods in Pakistan.
If nothing or not enough is done, it will get worse. But we aren’t helpless, the solutions are at hand: renewable energy and phasing out fossil fuels, to name two essential steps.
All it depends on is the political will to do so, then the mobilization will work as well.
(source: Pixabay)
First we shall establish the facts, as laid out by IPCC Report in their Summary for Policymakers. As staggering as they may be, they are no reason to capitulate.
Then we move on to some examples of the climate crisis, from droughts to floodings.
In the third and last part we will discuss the solutions to this crisis and what can already be done on a regional and national level. On an international level it should ideally become a process with its own dynamic, but that may take some time before it happens.
The Reality of the Climate Crisis
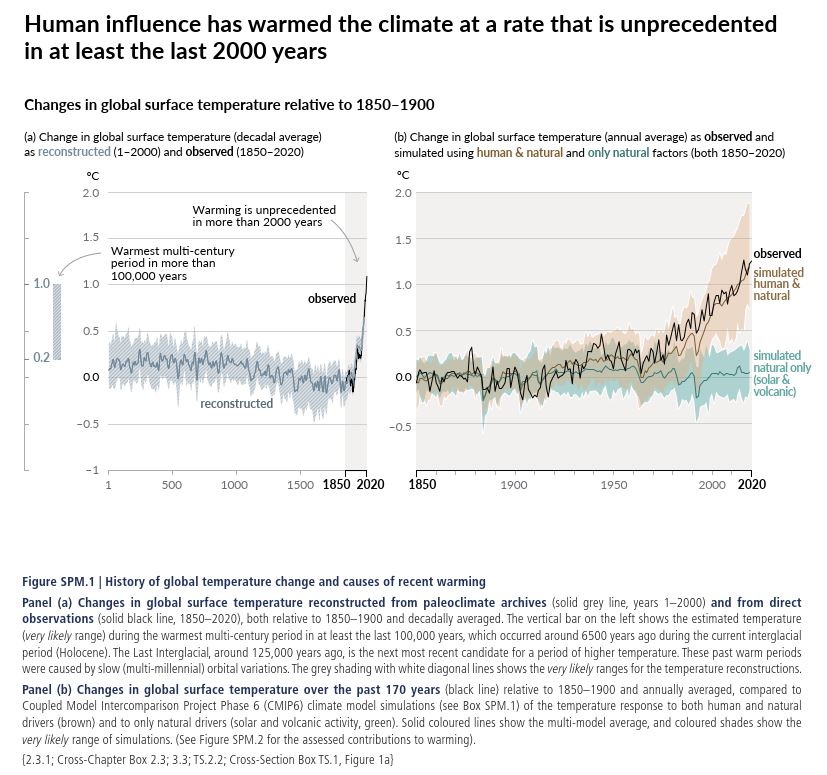
The Summary for Policymakers states that ‚it is unequivocal that human influence has warmed the atmosphere, ocean and land‘ (p. 4). These rapid and widespread changes have occurred in the atmosphere, ocean, cryosphere (which encompasses the frozen parts of Earth, such as glaciers and icesheets) and biosphere (from the Greek word bio = life, it is made up of the parts of Earth where life exists – from the ocean floor to the mountaintops).
Further, the observed increase of greenhouse gas concentrations since 1750 are irrefutably caused by human activities.
| Global Annual Mean Temperature and Co2 (source: https://www.britannica.com/science/global-warming/Climatic-variation-since-the-last-glaciation) |
| When you hear about the 1.5 °C or 2.0 °C climate target, the number alone may sound abstract. The number on its own, with one’s own experience, may leave the impression that it is the decision between wearing a sweater or a t-shirt. However, when compared to the temperatures of the Last Glacial Maximum one realizes how significant this seemingly little increase is: during that time, 21,000 years ago, the global annual mean temperature was about 4-5 °C (7-9 °F) colder than in the mid-20th century (1950s). Back then, continental ice sheets extended into the regions now known as Europe and North America, reaching as far south as present-day London and New York City. „At current rates of fossil fuel use, a doubling of CO2 concentrations over preindustrial levels is expected to take place by the middle of the 21st century (when CO2 concentrations are projected to reach 560 ppm). A doubling of CO2 concentrations would represent an increase of roughly 4 watts per square metre of radiative forcing. Given typical estimates of “climate sensitivity” in the absence of any offsetting factors, this energy increase would lead to a warming of 2 to 5 °C (3.6 to 9 °F) over preindustrial times.“ (section: Carbon dioxide) So, when such temperatures in the opposite direction caused ice sheets to extent to these great sizes, one only has to imagine what happens if Earth warms up to 5 °C. |
Since 2011, the concentrations have increased with carbon dioxide (CO2) reaching annual averages of 410 parts per million (ppm), methane (CH4) 1,866 parts per billion (ppb) and nitrous oxide (N2O) 332 ppb in 2019 (p. 4). It can be said with high confidence that the concentrations of CO2 were higher in 2019 than at any time in at least 2 million years, for both methane and nitrous oxide they were higher than at any time in the last
800,000 years (very high confidence).
„Since 1750, increases in CO2 (47%) and CH4 (156%) concentrations far exceed – and increases in N2O (23%) are similar to – the natural multi-millennial changes between glacial and interglacial periods over at least the past 800,000 years (very high confidence).“ (p. 8)
This, of course, also affects the hot and cold extremes which include heat waves and cold waves. It is virtually certain that the first have become more frequent and more intense across most land regions since the 1950s, while the latter followed the opposite trend.
The main driver of this change is human-induced climate change (high-confidence).
The report elaborates further: „Some recent hot extremes observed over the past decade would have been extremely unlikely to occur without human influence on the climate system. Marine heatwaves have approximately doubled in frequency since the 1980s (high confidence), and human influence has very likely contributed to most of them since at least 2006.“ (p. 8)
The change that is occurring in our climate is already affecting humanity, as the next figure will show. You may notice the striped hexagons (white-grey) and white hexagons, they indicate that there’s a low agreement in the type of change for the region as a whole; the grey hexagons, on the other hand, were used when there was limited data and/or literature that prevented assessment. Other countries indicate at least medium confidence.
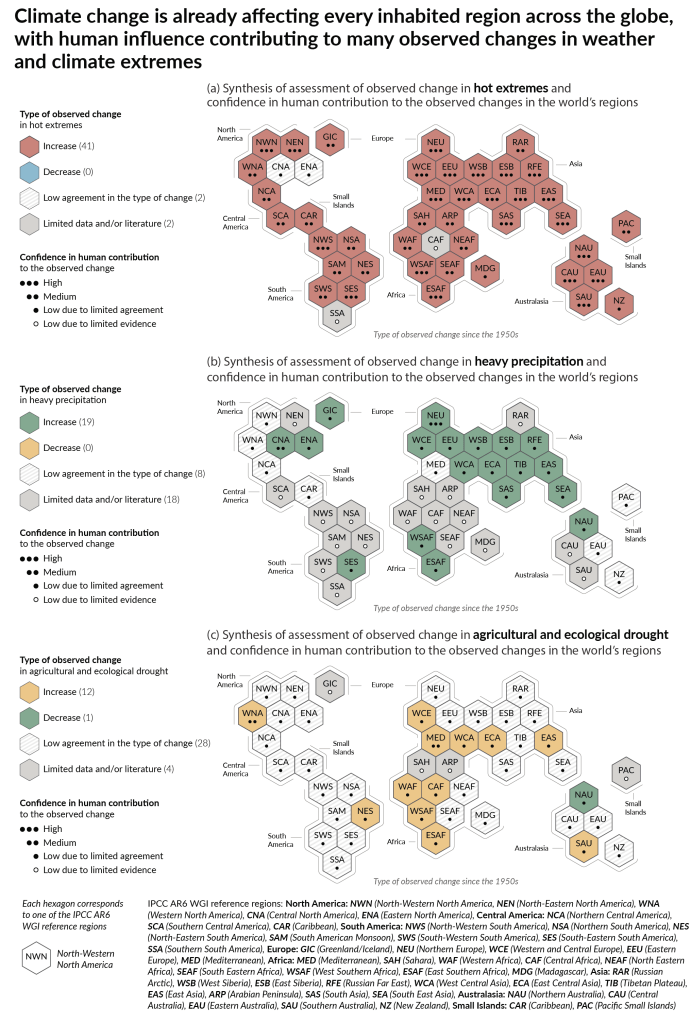
A single filled dot means there’s limited agreement, whereas a single empty dot means limited evidence (p. 10)
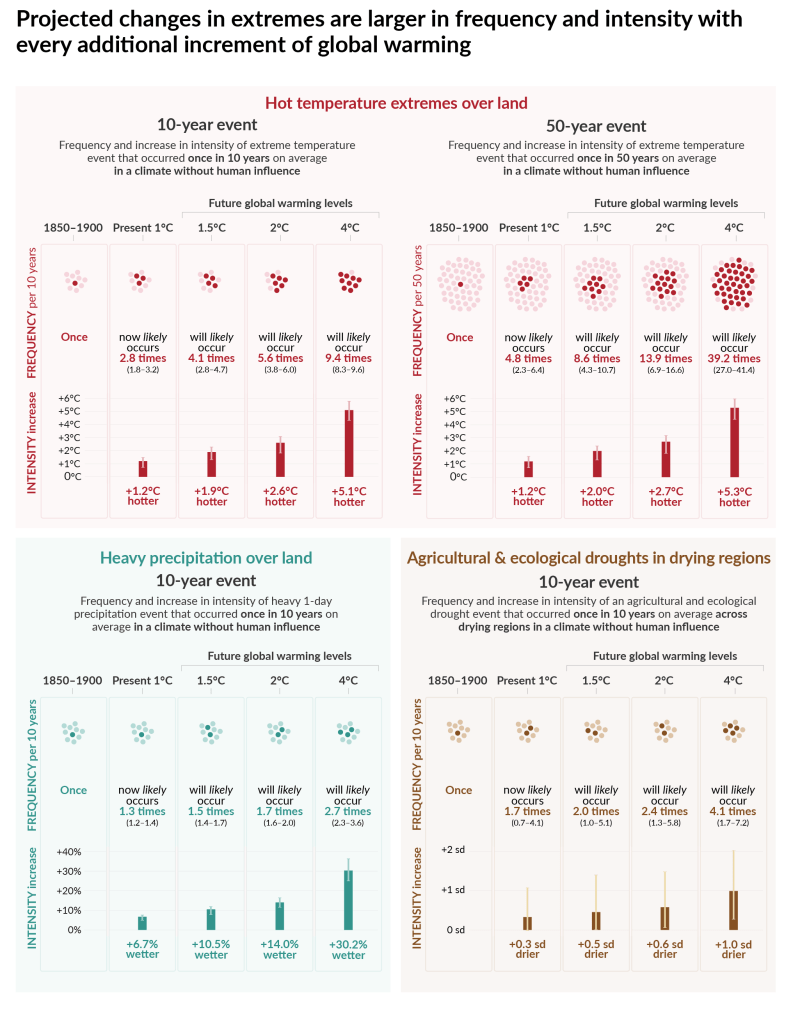
Lastly, we will have a look at the extremes without and with human influence. The following graphic shows hot temperature extremes over land (10-year and 50-year events), heavy precipitation over land (10-year events) and agricultural and ecological droughts in drying regions (also 10-year events). On the far left it shows without human influence, then the present frequency of said extremes and on the right the changes from 1.5 °C to 4.0 °C.
| Note |
| In the Guidance Note for Lead Authors of the IPCC Fifth Assessment Report on Consistent Treatment of Uncertainties (PDF-file, 6 pages.), the IPCC includes a table of the likelihood scale and explains beforehand how to interpret it: „Likelihood may be based on statistical or modeling analyses, elicitation of expert views, or other quantitative analyses. The categories defined in this table can be considered to have “fuzzy” boundaries. A statement that an outcome is “likely” means that the probability of this outcome can range from ≥66% (fuzzy boundaries implied) to 100% probability. This implies that all alternative outcomes are “unlikely” (0-33% probability).“ (p. 3) Virtually certain = 99-100 % probability Very likely = 90-100 % probability Likely = 66-100 % probability About as likely as not = 33 to 66 % probability Unlikely = 0-33% probability Very unlikely = 0-10 % probability Exceptionally unlikely = 0-1 % probability It is a different matter when it comes to confidence which is not to be mixed up with probabilistics: „Confidence should not be interpreted probabilistically, and it is distinct from “statistical confidence.” Additionally, a finding that includes a probabilistic measure of uncertainty does not require explicit mention of the level of confidence associated with that finding if the level of confidence is “high” or “very high.” (p. 3) Lastly, confidence results from both the level of agreement (high, medium, low) and the evidence (type, amount, quality, consistency). |
Source
Summary for Policymakers (Working Group I)
https://www.ipcc.ch/report/ar6/wg1/
From Floods to Droughts
As we have seen in the previous section, heavy precipitation and droughts will happen in higher frequency. In this section, I’m going to list a few examples to show what may lie ahead in even greater intensity and frequency. Flooding occurs not only when rivers overflow due to heavy rainfall or ice begins to melt in mountainous parts, it can also be the result of long dry periods when the soil can no longer absorb the water or in urban areas where the surface is paved (NOAA).
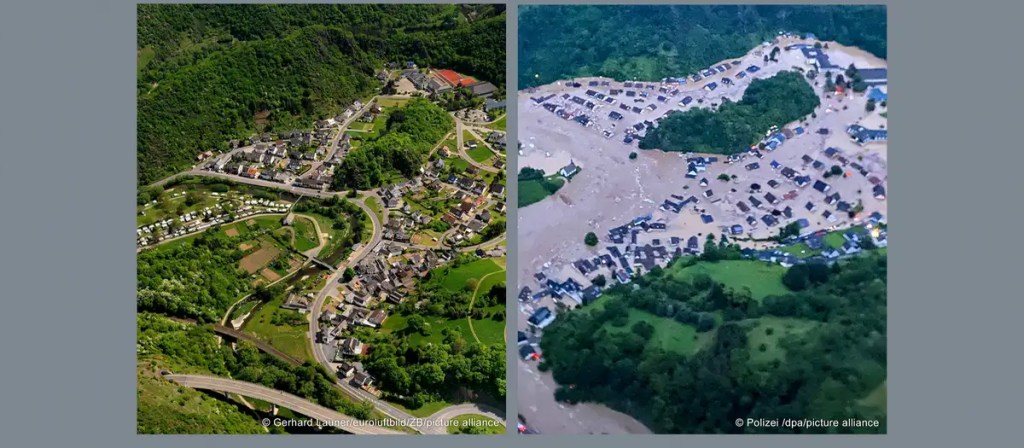
Example 1: Germany – Ahr Valley
From July 12 to 19, 2021, various regions in Europe were hit by extreme rainfall which was generated by a quasi-stationary atmospheric low pressure system named „Bernd“. Two federal states in Germany and adjacent regions in Belgium were hit the hardest. In fact, in Germany it was the costliest natural disaster in recent German history with losses of around €33 billion ($40 billion). With at least 189 people dead, it took more lives than any other flood in Germany in the past 50 years. Additionally, there were structual issues:
„Although heavy and disastrous rainfall had been forecast by the weather services a few days ahead, the early warning process and evacuation did not work well. Warnings from the issuing agency did not reach many of the intended recipients in a timely manner and automated early warning systems were either unavailable or did not function properly.“
Source
For further reads, see University Bonn: https://www.geographie.uni-bonn.de/de/forschung/arbeitsgruppen/ag-schrott/research/ahr-valley
Example 2: Pakistan – 2022 Floods
In 2022, extreme monsoon rains resulted in the worst flooding in a decade with more than
33 million affected people, 767,488 destroyed and 1,277,000 damaged houses. The floodwaters killed at least 1,700 people and engulfed tens of thousands of square kilometers. 12,800 people were injured by the floodings, including 4,000 children.
500,000 Pakistanis were displaced. Sindh, Balochistan and Khyber Pakhtunkhwa (KP) provinces were most affected.
Further, the devastating flood destroyed 3.5 million acres of cropland (= 14,164 km²).
For comparison, the land area of New York encompasses about 790 km² or 195,213 acres.
On top of that, 1,162,000 livestock perished, thus wiping out livelihoods and jeopardizing Pakistan’s food security. In Balochistan, Sindh, KP and Punjab 80 provinces were declared „calamity-hit“. And in 41 of those provinces, an estimated 800,000 Afghan refugees were hosted with the majority being in four districts: Peshawar (210,000), Quetta (170,000), Nowshera (77,700) and Karachi (71,500). (source: reliefweb)
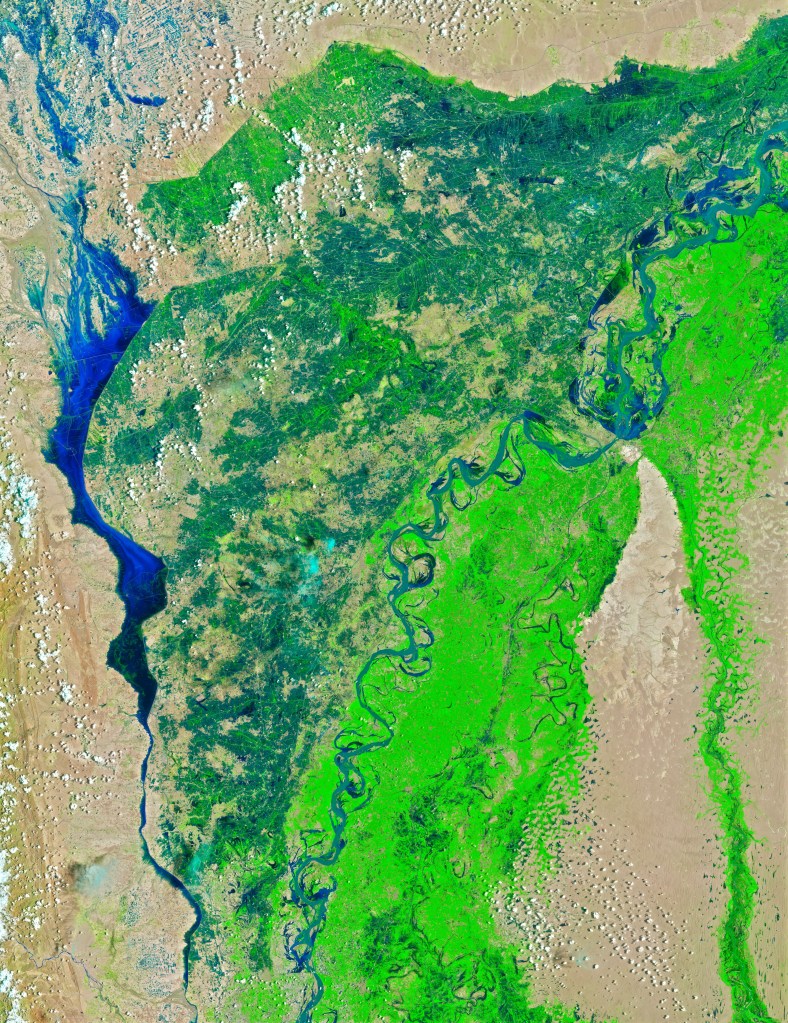
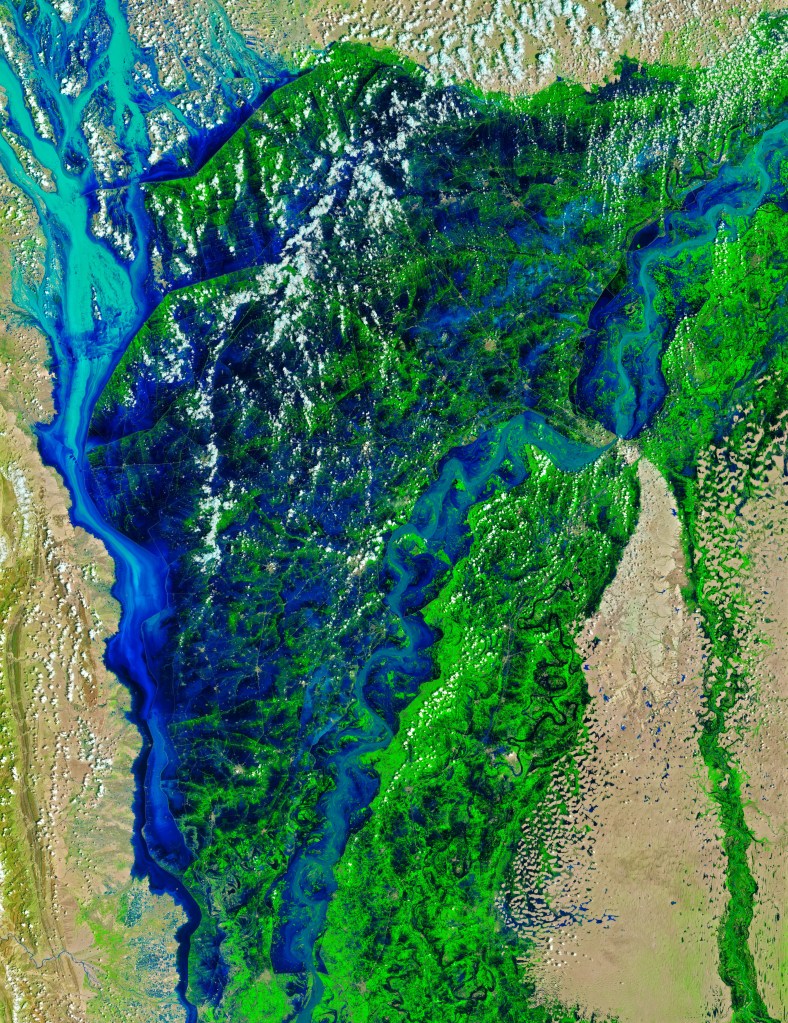
The slideshow above shows the devastation caused by the flood and below you see the entire map of Pakistan. Unfortunately, the problems don’t end there for Pakistan:
„The effect of the monsoon rains has been compounded by the continued melting of Pakistan’s 7,000 glaciers. The country holds the most glacial ice found outside the polar regions. Climate warming and recent heat waves have precipitated several glacial-outburst floods. In the rugged northern part of the country, the combined rain and meltwater has turned slopes into hill torrents.“ (source: NASA Earth Observatory)
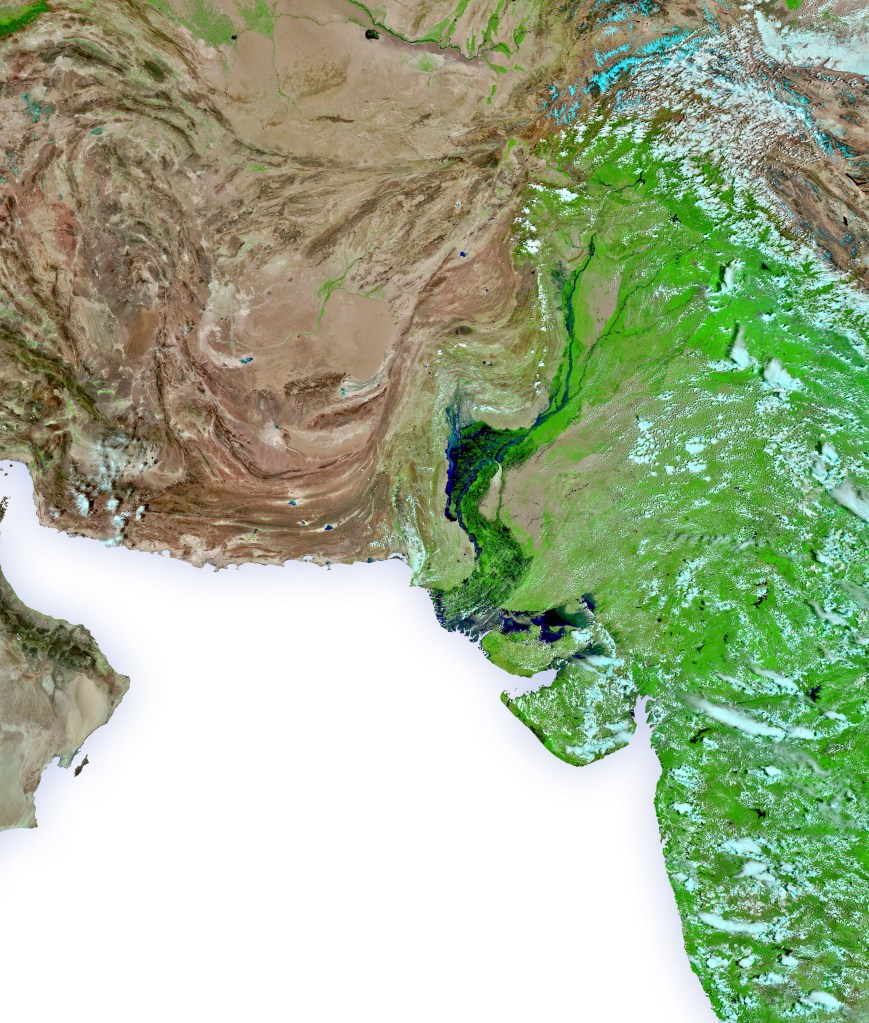
(source: NASA Earth Observatory)
Sources
Pakistan Flood Response: UNHCR Supplementary Appeal, September 2022 – December 2023 (https://reliefweb.int/report/pakistan/pakistan-flood-response-unhcr-supplementary-appeal-september-2022-december-2023)
Devastating Floods in Pakistan
https://earthobservatory.nasa.gov/images/150279/devastating-floods-in-pakistan
Geography and Travel: New York City
https://www.britannica.com/place/New-York-City
I used the following website to convert acres to km² and vice versa
https://www.unitjuggler.com/convert-area-from-acre-to-km2.html
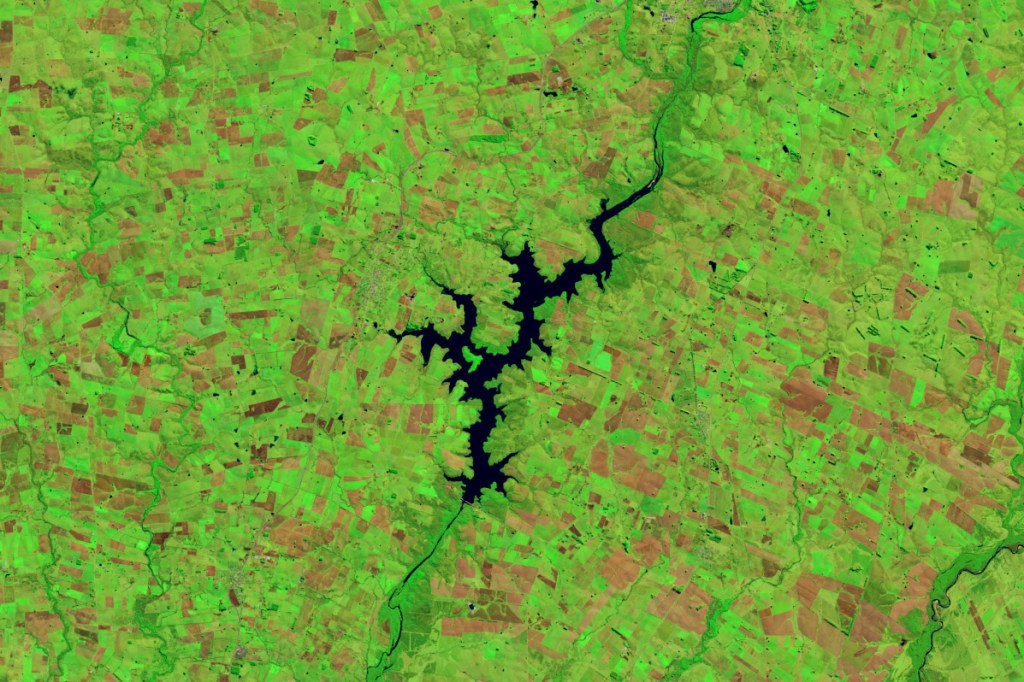
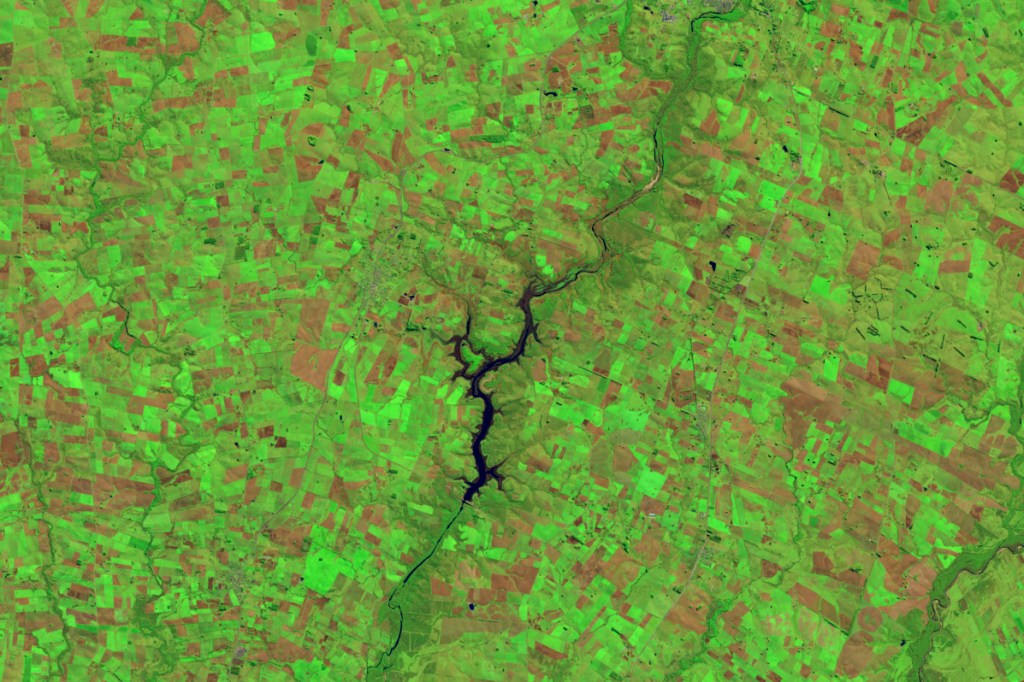
Example 3: Uruguay Drought
Uruguay is experiencing a multi-year drought which led to the two main freshwater reservoirs, which provide water to the capital city Montevideo, to nearly run dry. Paso Severino, the larger of the two, was estimated to just hold 2.4% of its 67-million-cubic-meter capacity on June 28 (see images taken below by Operational Land Imager-2 on Landsat 9 in false colour to distinguish water more easily). The images below show Paso Severino; the first shows the reservoir on June 2, 2022 and the latter on June 13, 2023, about one week before the Uruguayan government declared a water crisis (source: NASA Earth Observatory).
The situation wasn’t entirely unavoidable, as an article of The Guardian explains:
„The government says previous administrations, including the leftwing Broad Front coalition that governed from 2005 to 2020, did not invest adequately in water infrastructure.
Before the crisis, Lacalle Pou’s administration had announced a $210m project to take safe drinking water out of the Rio de la Plata, leaving aside another project that had been designed but not started by the previous government.
José Mujica, the president between 2010 and 2015, has acknowledged some responsibility. “We all fell asleep,” he said when asked about the crisis.“
Similar to the catastrophe in the Ahr Valley in Germany, it is also a structural problem.
While Uruguay may come out of the crisis slowly, according to the meteoroligst Mario Bidegain, water scarcity and water supply is going to be of great importance to all countries. Climate mitigation therefore also means securing the water supply globally.
Sources
Reservoirs Run Dry in Montevideo
https://earthobservatory.nasa.gov/images/151574/reservoirs-run-dry-in-montevideo
Drought leaves millions in Uruguay without tap water fit for drinking
https://www.theguardian.com/world/2023/jul/15/drought-leaves-millions-in-uruguay-without-tap-water-fit-for-drinking
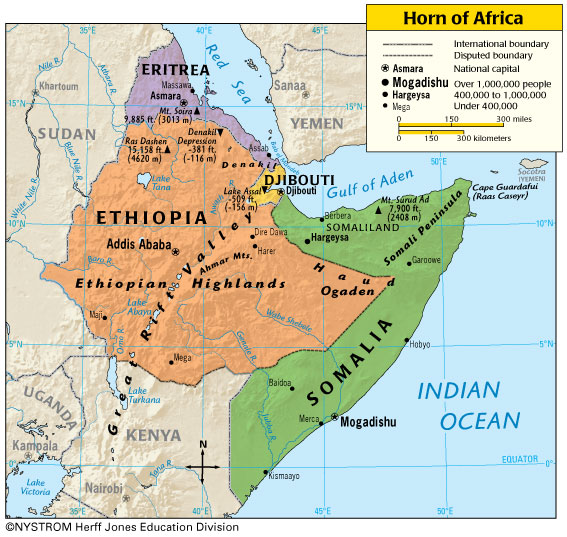
Example 4: Drought in The Horn of Africa
The Horn of Africa is a region that is home to the countries Djibouti, Eritrea, Ethiopia and Somalia. Broader definitions exist too and when they are used, parts or all of Kenya, Sudan, South Sudan and Uganda belong to the region too (source: Britannica). In this instance, the report on the drought by OCHA reliefweb also includes Kenya.
In recent years, the region has been hit by a series of droughts leading to crop failures and a lack of water and food. Heavy rain in recent months led to flooding which has caused widespread destruction and displacement, thus worsening the humanitarian situation. Further, due to the flooding health risks such as water borne diseases are now a concern as well. In Somalia and Ethiopia, over 2 million have been internally displaced „while over 260,000 new refugee and asylum-seekers have crossed into drought affected areas of Kenya, Ethiopia and Somalia since January 2022“ (reliefweb).
(source: africa blogspot)
For a better overview, I made a table which includes the points of the article „East and Horn of Africa, and the Great Lakes Region: UNHCR Drought Situation Response Update #10 – May 2023“ by the reliefweb. I also included a few facts about each country from the book „Der Neue Kosmos – Welt Almanach & Atlas“.
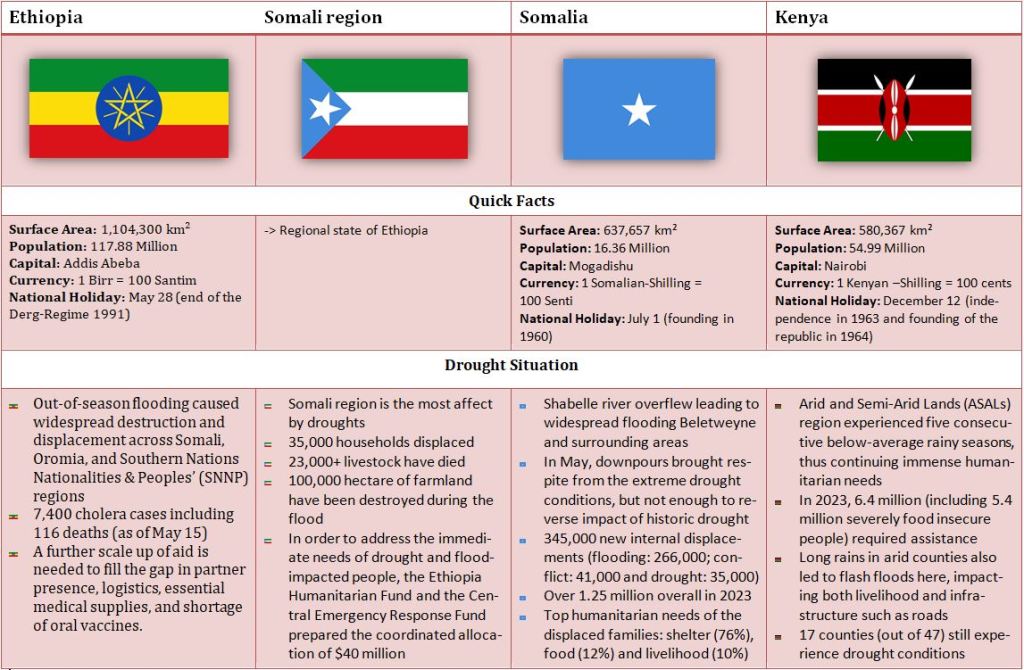
For further reading, or in case you want to read the article of the reliefweb yourself, you’ll find them in the sources as per usual.
Sources
Geography and Travel: Horn of Africa
https://www.britannica.com/place/Horn-of-Africa
East and Horn of Africa, and the Great Lakes Region: UNHCR Drought Situation Response Update #10 – May 2023 (https://reliefweb.int/report/somalia/east-and-horn-africa-and-great-lakes-region-unhcr-drought-situation-response-update-10-may-2023)
Horn of Africa Map Pictures
http://maps-africa.blogspot.com/2012/05/horn-of-africa-map-pictures.html
Book: Der Neue Kosmos – Welt Almanach & Atlas
Publisher: Kosmos
Language: German
Pages: 720 (Ethiopia p. 54, Somalia p. 385, Kenya p. 234)
Price: €26.00 ($29.18 US, 22.28 GBP)
Example 5: Canadian Wildfire
For our last example, we look to the Americas and to Canada in particular. By now, you certianly have heard about the fires raging in Canadia and that the consequences were even felt in the United States (meaning the smoke that led to a drastic decline of air quality). Cause of these major outbreaks was a combination of unusual heat, dry lightning and drought. On July 13, nearly 600 out-of-control fires burned throughout the country.
Environment Canada had to issue air quality warnings for several communities in British Columbia, Alberta, and the Northwest Territories as dense plumes of smoke streamed east.
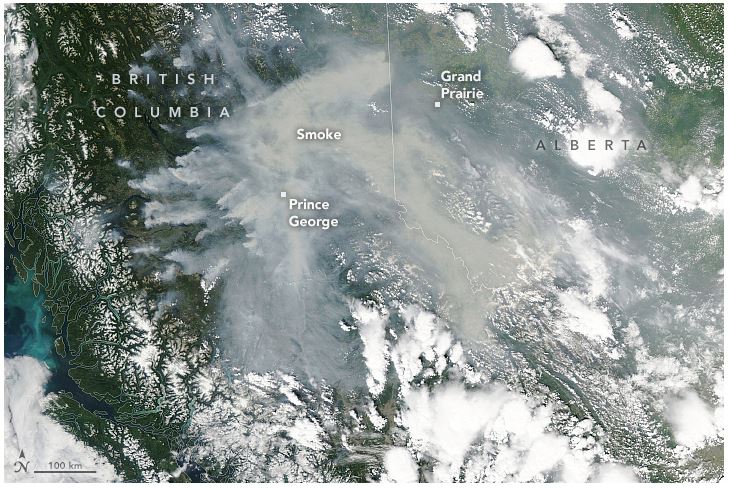
A record was also set for pyrocumulonimbus (pyroCb), which are smoke-infused storm clouds: “This surge in activity has made 2023 the most active year for pyroCbs both in Canada and worldwide since we began tracking their numbers closely about a decade ago.” As of July 13, with about six weeks left in the Canadian fire season, Peterson and colleagues had observed 90 pyroCbs in Canada and 104 worldwide in 2023. The previous records, both set in 2021, were 50 for Canada and 100 worldwide. As of July 12, 2023, 1.2 million hectares (3 million acres) had burned in British Columbia – 30 times the average for that point in year.
At a national scale, the fires had charred 9.4 million hectares, an area about the size of the state of Indiana. In 1997, it was the second-highest with 7.1 million hectares burned.
Wildfires do occur naturally, but climate change can cause hotter, drier conditions that can exacerbate wildfires, research has shown. A 2018 study on Canada wildfires suggested that “human-induced climate change contributed greatly to the probability of the observed extreme warm temperatures, high wildfire risk, and large burned areas.” A 2023 study arrived at similar results for California wildfires: “Our results indicate that nearly all the observed increase in burned area is due to anthropogenic climate change.” (CNBC)
Source
Fires Rage in British Columbia
https://earthobservatory.nasa.gov/images/151578/fires-rage-in-british-columbia
Wildfire smoke hits New York again: ‘We are truly the first generation to feel the real effects of climate change,’ Gov. Hochul says (June 28, 2023)
https://www.cnbc.com/2023/06/28/canadian-wildfire-smoke-is-impacting-air-quality-in-new-york-again.html
Solutions to the Crisis
We’ve seen the destruction weather extremes cause, but next to ocean acidification, sea level rise and many other threats they are not the only thing we have to worry about.
There’s no benefit in painting a picture of doom and gloom, especially since we – the people who live now – are at a turning point of human history. We can still prevent the worst and pressure politicians and governments into doing the right.
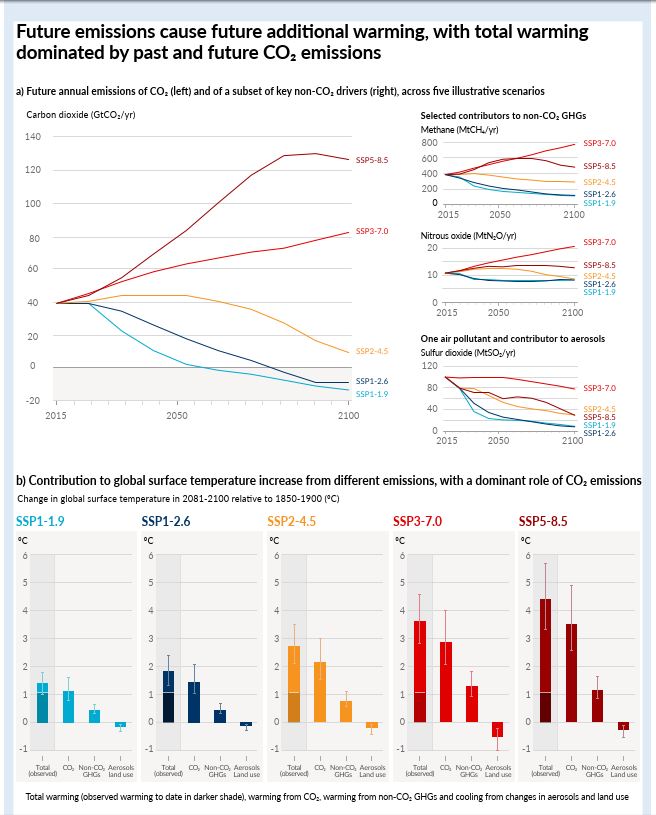
In the graphic below, you can see the different scenarios for carbon dixoide emissions (on the right for the other greenhouse gases respectively) while b) shows the impact on global surface temperature. SSP3-7.0 and SSP5-8.5 show the worst case where the CO2 emissions roughly double and the temperature could increase to 4 °C and more by 2100.
SSP2-4.5 shows CO2 emissions remaining around the current levels until the middle of the century, global surface temperature nearly increasing to 3 °C. Finally, SSP1-2.6 and SSP1-1.9 show the best case scenario with low and very low greenhouse gas emissions.
Around or after 2050, the CO2 emissions would decline to net zero and then followed by negative CO2. The global surface temperature would be around 1.5°C or nearly 2°C.
The darker shade in the bar chart displays the observed warming to date.
Of course, even in the best-case scenario not everything can be reversed in the near term.
As it is stated in D. 1.6 on page 30: „If global net negative CO2 emissions were to be achieved and be sustained, the global CO2-induced surface temperature increase would be gradually reversed but other climate changes would continue in their current direction for decades to millennia (high confidence). For instance, it would take several centuries to millennia for global mean sea level to reverse course even under large net negative CO2 emissions (high confidence).“ Mitigation and Adaptation are therefore both of great importance.
Mitigation
In order to combat climate change, we first need to understand where our emissions are coming from. For this, we use a chart which shows the breakdown of global greenhouse gas emissions in 2016, published by Climate Watch and the World Resources Institute.
When talking about climate change mitigation, one shouldn’t focus solely on one sector as all are contributing to this crisis and each tonne further warms the planet.
Without further ado, here’s the chart that will be of key importance in this section:
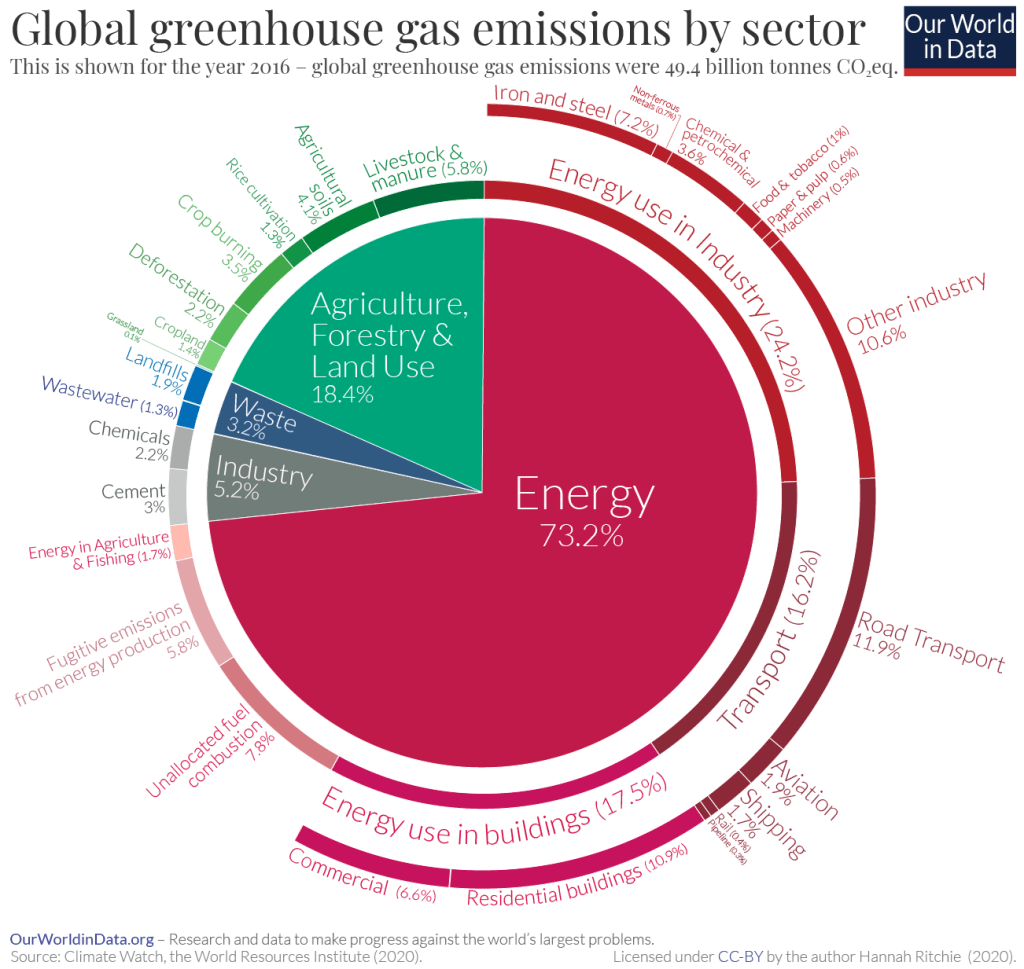
As we can see, the biggest contributor to global Co2-emissions is the energy sector. Nearly taking up three-quarters (73.2%); of these, 17.2% fall onto energy use in buildings; 16.2% on transport (road transport making up the most with 11.9%) and 24.2% on industry.
The second biggest contributor to global Co2-emissions is the sector agriculture, forestry and Land Use with 18.4% where livestock and manure take up 5.8%. Further down with 5.2% is the industry, or to be precise: direct industrial processes like cement where Co2 is created as a byproduct when limestone (CaCO3) is converted to lime (CaO). Lastly, waste is the fourth and lowest contributor with 3.2%, landfills make up nearly two-third of it (1.9%) and wastewater 1.3%.
The following solutions have already been implemented to some extent or another, renewable energies for instance (solar panels, hydropower, wind turbines, etc.).
Nuclear energy is more in a grey area (as the energy production itself is carbon neutral), but it is preferable to coal power plants. Hence, it should be seen as complementarily (if the circumstances allow) to renewable energies.
The Energy Sector
Both residential (10.9%) and commercial (6.6%) buildings could reduce their Co2-emissions by installing solar panels on their roofs or as a project of a municipality (solar farm).
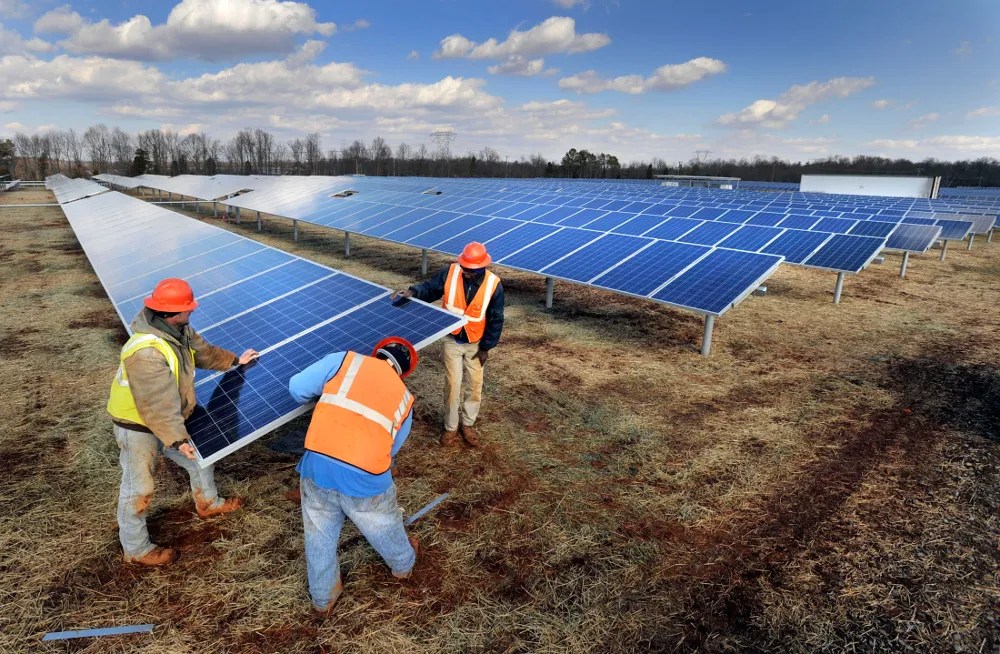
In addition to providing green energy, solar farms and other renewable projects also create jobs that will always be needed. Then there’s also the reduction of dependency on energy companies. Of course, there may be the objection that the sun doesn’t always shine – and that’s where energy diversification comes into play. Whether it is on a national or regional level, next to solar farms wind turbines, biogas and hydropower (where possible) would also be build. Environmental protection and species conservation always play a role too when renewables are planned, that is why some areas are unfit in their entirety. Nevertheless, conflicts will arise and then the option is between a limited impact on the ecosystem and the uncontrollable that is brought by fossil fuels like coal power plants.
The industry, which is responsible for 24.2% and thus almost a quarter, would in turn also benefit from offshore and onshore wind turbines as well as other renewable energy sources. And the quicker fossil fuels are phased out, the better. The workers who are employed by these industries should then either be compensated to live a decent life (for instance if they are near or already past retirement age and can’t adjust), supported through advanced training and introductory training (some may prefer to stay in the energy sector) or provide other options if desired (perhaps the one or other, if the support structure exists, wants to get a higher educational qualification). Ideally, companies like Exxon Mobile are brought before court – especially the top management – for actively spreading disinformation about climate change while knowing about the climate science (Scientific American: Exxon Knew about Climate Change almost 40 years ago).
Finally, cooling during the Summer months and heating during the Winter months require air conditioners and furnaces. Both emit Co2 as well, but one doesn’t have to relinquish it in order to be reduce the emissions. Instead, systems like the heat pump can even reduce your electricity use for heating by around 50% which in turn means more money is available for personal or family budgeting.
„High-efficiency heat pumps also dehumidify better than standard central air conditioners, resulting in less energy usage and more cooling comfort in summer months.“
(US Department of Energy)
In the Winter months, it works more efficiently too if integrated into your old system: „Although most heat pumps use electric resistance heaters as a backup for cold weather, heat pumps can also be equipped in combination with a gas furnace, sometimes referred to as a dual-fuel or hybrid system, to supplement the heat pump. This helps solve the problem of the heat pump operating less efficiently at low temperatures and reduces its use of electricity.“
If there’s the political will, it is certainly possible to one day save 17.5% to 41.7% of Co2-emissions by steadily transitioning to renewables (and neutrals) without having to fear to lose the current standard of living. Through technology transfer to poorer countries, the standard of living can be increased everywhere while simultaneously protecting the environment. It is going to be a long process, but one that is well worth it!
Finally, we move to transport with 16.2% and more specifically road transport.
60% of road transport emissions come from passenger travel (cars, motorcycles and buses) and 40% from road freight (lorries and trucks). As both make up 11.9% of the Co2-emissions, „this means that, if we could electrify the whole road transport sector, and transition to a fully decarbonized electricity mix, we could feasibly reduce global emissions by 11.9%“ (Our World in Data, Section: Energy by Sector). This, of course, also requires a charge station infrastructure that needs yet to be built. When it comes to traffic within cities, the use of bicycles can be increased by adding bike lanes, invest in public transport (from bus and trams to subways and intercity railway connections) and reducing the amount of parking lots and increase the price for parking tickets.
Agriculture, Forestry & Land Use
In this sector, the biggest source of Co2-emissions is livestock and manure (5.8%).
You likely already know that beef and lamb tend to have a high carbon footprint, the reason for that being a process called ‚enteric fermentation‘ which happens when microbes in their digestive systems break down food. A byproduct of this process is methane.
Therefore, eating less is an effective way of reducing the emissions of one’s diet.
Besides, considering how meat of different sorts are produced (from cattle to poultry) in factory farms there’s also an ethical perspective to changing one’s diet. If meat consumption decreased, more crops would be available to humans too.
Deforestation makes up 2.2% of the Co2-emissions in this sector. While it doesn’t sound like much, it is still 988 million tonnes of Co2. Naturally, reforestation is here the answer and it is also already practiced. It should always be done with native plant species, as they are used to the climatic conditions and the locals know to make best use of their traits.
Reforestation is a slow process, spanning over one to two decades (or even longer), which is another reason why the climate crisis must be tackled on various fronts.
„And even a tree-planting campaign can be doomed by a “misplaced emphasis on how many trees are planted rather than how many survive,” the study warned. It calls for developing guidelines on what seeds will thrive in different environments, especially as climate change shifts plant species to new regions.
“It’s not just about planting a tree. It needs to be done thoughtfully and well, because you can’t just stick a tree in the ground and come back in 100 years and have a forest,” said Edge. It takes an immense amount of money, labor, and patience to turn a seed into a sapling. “We don’t want to just waste our time sticking a seedling in the ground that’ll die.“ (national geographic)
Sources
Emissions by sector – Our World in Data
https://ourworldindata.org/emissions-by-sector
Exxon Knew about Climate Change almost 40 years ago
https://www.scientificamerican.com/article/exxon-knew-about-climate-change-almost-40-years-ago/
Heat Pump System
https://www.energy.gov/energysaver/heat-pump-systems
Planting trees helps fight climate change—but we need billions more seedlings
https://www.nationalgeographic.com/environment/article/planting-trees-helps-fight-climate-change-but-we-need-billions-more-seedlings
Adaptation
Adaptation, as described by the Journal Nature, is the „process of adjustment to actual or expected climate change and its effects“. We are already more than 1 °C above the 1850-to-1900 baseline and it will continue to rise through mid-century and very likely beyond.
Two years ago, when the article was published in Nature, 2021 was a year of record-breaking extremes that span from massive heatwaves and wildfires in the United States and Canada, to deadly floods in China and Germany.
| China: The Flooding in the northern Shanxi Province (October 11, 2021) (source: https://www.bbc.com/news/world-asia-china-58866854) |
| Less than three months after extreme rains in the Henan province left more than 300 people dead, torrential rain caused more than 17,000 houses to collapse and triggered landslides across more than 70 districts and cities in the province. More than 120,000 had been resettled as a result. Overall, around 1.76 million people were affected. Between 1981 and 2010, the northern Shanxi Province saw an average rainfall in October of 25mm. The extreme rainfall skyrocketed it to 185.6mm – the sevenfold. |
In the following article by Nature, published on October 28 2021, the authors outline three opportunities for research to accelerate adaptation. These are 1) the Mechanisms of the Paris Agreement to raise ambitions, 2) ensuring resilience of multilateral, domestic, and private investment and 3) research must accompany adaptation actions.
https://www.nature.com/articles/s43247-021-00294-5
Working Group II of the IPCC wrote, among other things, about the adaptation measures.
There’s already good news regarding adaptation planning and implementation. Both have continued to increase and the growing public and political awareness of climate impacts and risks „resulted in at least 170 countries and many cities including adaptation in their
climate policies and planning processes (high confidence)“ (p. 20). There are multiple additional benefits generated by adaptation „such as improving agricultural productivity, innovation, health and well-being, food security, livelihood, and biodiversity conservation as well as reduction of risks and damages (very high confidence)“ (p. 20).
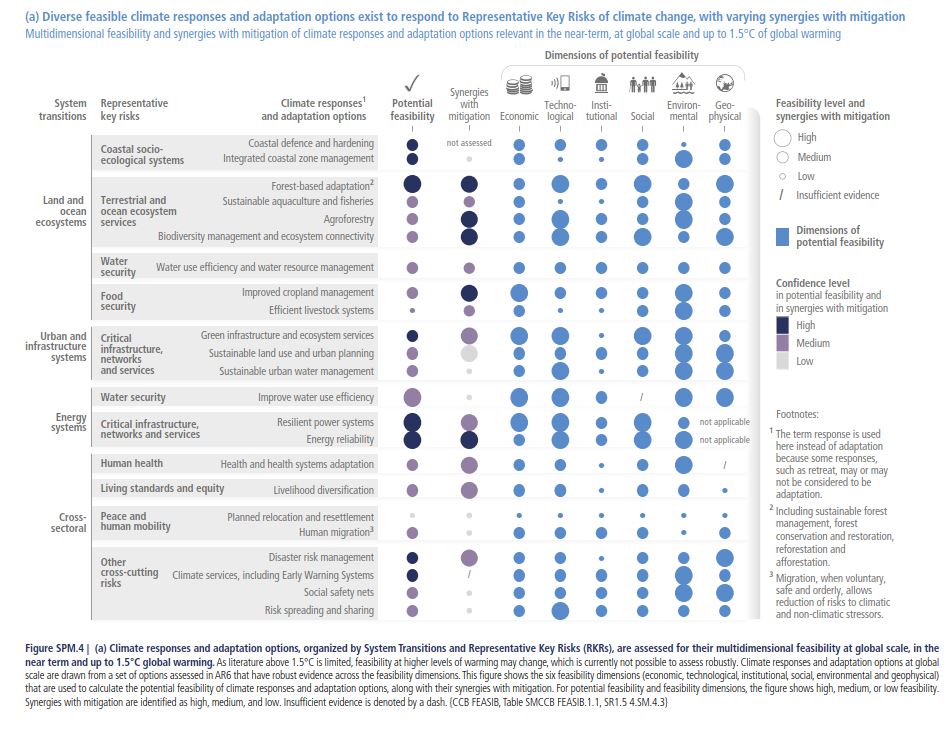
There are two very informative graphics included in the report of Working Group II, on page 22 and 23 respectively. Neatly summarized, the first graphic presents the key risks, the adaptations and responses, the potential feasibility, synergies with mitigation and the dimension of potential feasibility. As it is scientifically evaluated, you’ll see the same use of likelihood and confidence as in Working Group I.
The second graphic shows how the climate adaptations and responses affect ecosystems, ethnic groups, gender equity and low-income groups. Further, the researchers also included how it relates to the Sustainable Development Goals.
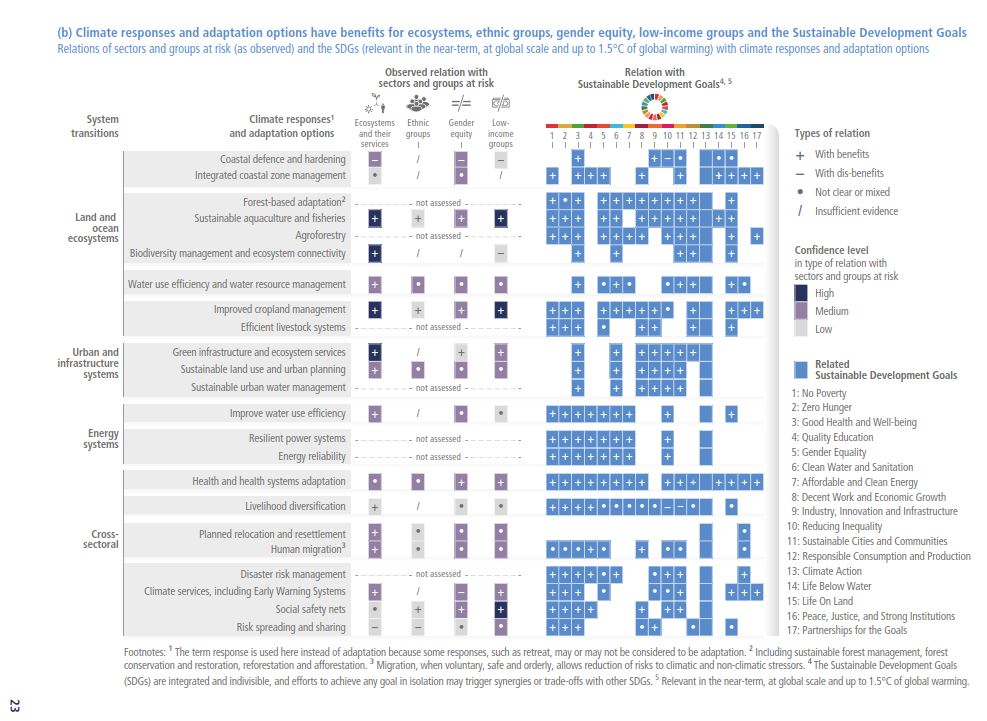
I hope you can read the graphics, because I took a screenshot of both and then imported them here. The quality may be compromised as a result.
Before I turn to an example, let’s quickly take a look what the report has to say on ecosystems within this framework of adaptation and response. In Section C, 2.4 and 2.5 we find the scientific assessments:
„Conservation, protection and restoration of terrestrial, freshwater, coastal and ocean ecosystems, together with targeted management to adapt to unavoidable impacts of climate change, reduces the vulnerability of biodiversity to climate change (high confidence). The resilience of species, biological communities and ecosystem processes increases with size of natural area, by restoration of degraded areas and by reducing non-climatic stressors (high confidence). To be effective, conservation and restoration actions will increasingly need to be responsive, as appropriate, to ongoing changes at various scales, and plan for future changes in ecosystem structure, community composition and species’ distributions, especially as 1.5°C global warming is approached and even more so if it is exceeded (high confidence). Adaptation options, where circumstances allow, include facilitating the movement of species to new ecologically appropriate locations, particularly through increasing connectivity between conserved or protected areas, targeted intensive management for vulnerable species and protecting refugial areas where species can survive locally (medium confidence).“
For humanity in general it would be beneficial to view nature through the holistic lens, in nature ethics holism means that ecosystems as a whole have the right to exist. When decisions are made, their right to exist is recognized and flows into the considerations. It naturally includes the conservation and protection of existing nature reserves and undoing damage done to the environment to the best possible extent (restoration). Conflicts will continue to emerge, and the one or other has to yield, but it is going to be sustainable.
This brings us to the benefits of the adaptation and response policies of C2.5:
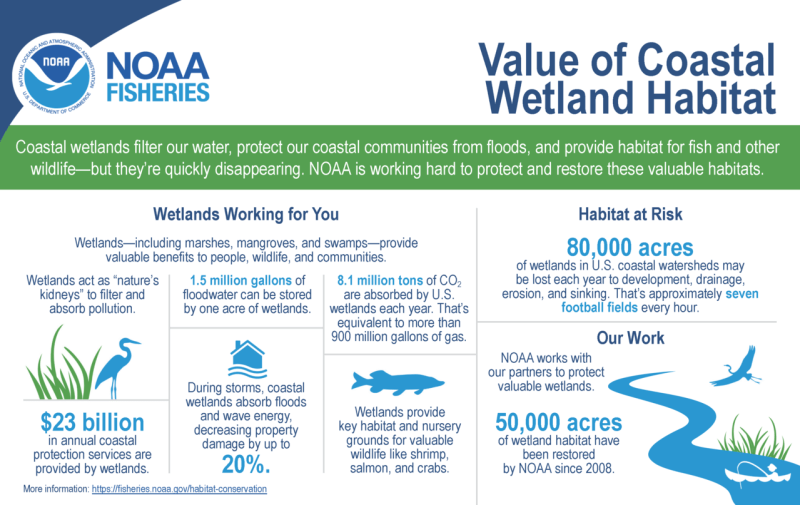
„Effective Ecosystem-based Adaptation reduces a range of climate change risks to people, biodiversity and ecosystem services with multiple co-benefits (high confidence). Ecosystem-based Adaptation is vulnerable to climate change impacts, with effectiveness declining with increasing global warming (high confidence). Urban greening using trees and other vegetation can provide local cooling (very high confidence). Natural river systems, wetlands and upstream forest ecosystems reduce flood risk by storing water and slowing water flow, in most circumstances (high confidence). Coastal wetlands protect against coastal erosion and flooding associated with storms and sea level rise where sufficient space and adequate habitats are available until rates of sea level rise exceeds natural adaptive capacity to build sediment (very high confidence).“
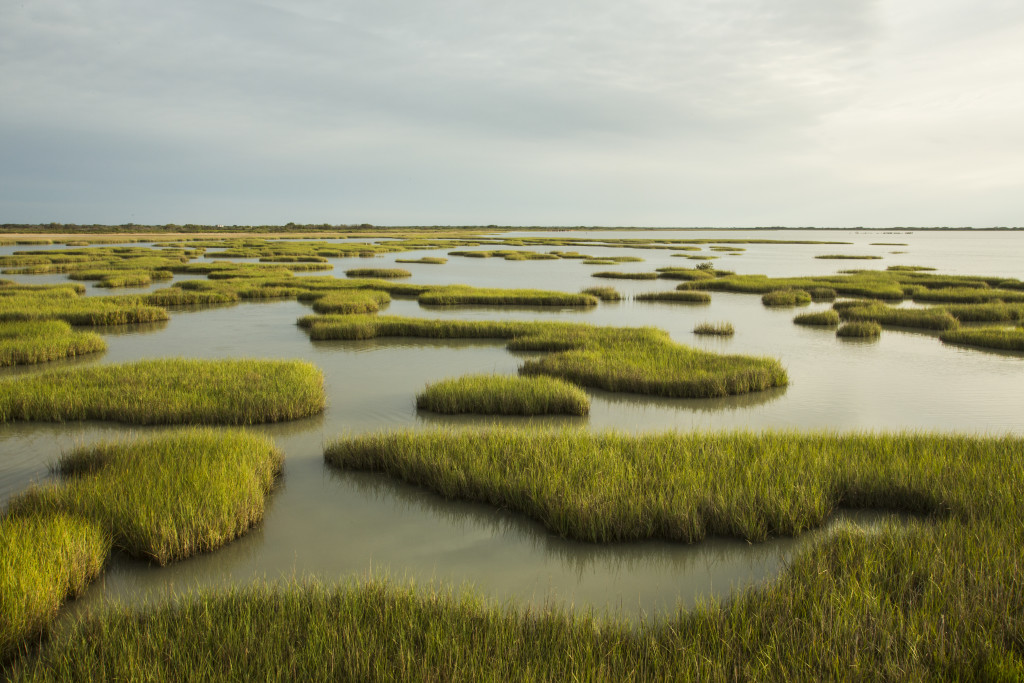
The majority of all documented adaptation is made up by water-related risks and impacts (see p. 21, C. 2.1). Consequently, I’ll broach on the subject of coastal wetland (as you can see in the image above), it is an important subject since many large cities are near the coast and at risk of sea level rise and flooding. Not to mention the danger posed by rivers.
For this example, I’ll focus on the coastal wetlands in the US (otherwise it would go beyond the scope of the discussion and make this entry too long).
Coastal wetlands play an important role for commercial fishing, because over 90 percent of all commercial and recreational fish and shrimp species spend some part of their life cycle in a coastal salt marsh. This means for the fisheries industry at the Goalf Coast, that the loss of these wetlands would not only impact the fish and shrimp species but also have serious and substantial impacts on said industry. Additionally, they also play an indirect but critical role in maintaining water quality of coastal estuaries and open water by cleaning pollutants and sediment from urban runoff before it enters the bays and oceans.
Only few wetlands will likely be able to migrate as the sea level rises, since the conditions need to be very gently to migrate landward. In many areas, the topography rises too quickly which will lead to a loss until the sea level rises enough to reach higher elevations.
In other words: the wetlands loss results in changes that last for centuries.
„In addition, many areas just inland from coastal salt marshes have been developed and protected with bulkheads or seawalls, such that wetlands are impeded from migrating inland.“
(source: Texas A&M Agrilife Extension)
The article mentions ways to protect these wetlands, with one being the most promising and ‚most easily applicable‘ legal framework. A similar mechanism to the rolling easement provisions of the Texas Open Beach Act is proposed.
| The Texas Open Beach Act – Explanation by Texas A&M |
| Unique among most states, Texas maintains a “rolling easement” on the Gulf shores to protect public access to the state’s beaches. The concept embodied in the TOBA has been termed a “rolling easement” and it evolved from Texas common law which recognized that Gulf beaches have been used by the public since “time immemorial” and that barrier islands are constantly shifting. The TOBA allows private land owners to develop their beachfront property as long as that development does not interfere with public access. As the vegetation line gradually moves the public access easement takes effect. The Texas Open Beaches Act (TOBA) was passed in 1959 to assure that the public has the “free and unrestricted right of ingress and egress to and from” public beaches, defined as the area between the line of vegetation and the mean low tide line. Because the vegetation and low tide line shift due to natural coastal processes, the demarcation lines for public beaches are not static. The public’s right of access, or easement, moves as well. The TOBA prohibits the construction of an “obstruction, barrier, or restraint of any nature which would interfere with the free and unrestricted right of the public” to access the beach. Holding back the sea, either through bulkheading or seawalls is, therefore, not permitted along public beaches. One thing that should be noted is that the public easement created by the TOBA does not affect the title to the property to which it attaches. The TOBA, however, makes that ownership subject to an easement that allows the public free and unrestricted use of the beach. |
Another solution is the reconstruction of wetlands that have been lost to erosion and subsidence. According to the author, considerable progress has already been made.
Sources
IPCC Sixth Assessment Report – Working Group II
https://www.ipcc.ch/report/sixth-assessment-report-working-group-ii/
China floods: Nearly 2 million displaced in Shanxi province
https://www.bbc.com/news/world-asia-china-58866854
Research for climate adaptation
https://www.nature.com/articles/s43247-021-00294-5
Coastal, Non-Deltaic Wetlands and Sea Level Rise
https://coastalresilience.tamu.edu/home/wetland-protection/
Infographic: Value of Coastal Wetland Habitat
https://www.fisheries.noaa.gov/infographic/infographic-value-coastal-wetland-habitat
Rolling Easements & the Texas Open Beaches Act
https://coastalresilience.tamu.edu/home/wetland-protection/policy-framework/bay-and-ocean-side-submerged-lands-some-fundamental-differences-in-law-and-management/the-texas-open-beaches-act-an-exceptional-example-of-a-rolling-easement/
A Very Narrow Timeframe
On April 10 2022, I already wrote about the climate crisis in Science News #013 (for the time being, the series is decommissioned). I’ll only include the summary at the end, which shows the key points of the Nature Article.
- 2025 is the latest date that global emissions should peak and then decline drastically, for a 50% chance to limit warming to 1.5 °C.
In order to achieve the current goal, Co2-emissions would need to nearly halve by 2030 and reach ’net zero‘ by 2050.
Our current course – scientists estimated – puts us on a path for a 3 °C rise above pre-industrial levels, - On a positive note: the price of renewable-energy technologies strong decreased and the global economy overall is getting cleaner.
Between 2010 and 2019, global energy intensity decreased by 2% annually – reversing a trend from the decades prior, - In order to the reach the 1.5 °C goal, some fossil fuels must remain underground.
Models slightly above this limit say that emissions from currently existing and planned fossil fuel projects exceed it, - Net-zero emissions cannot be achieved by reducing Co2-emissions alone, carbon dixodie extraction will also be needed,
This can be achieved by reforestation, improving agricultural practices or a variety of nascent technologies that are able to to capture carbon emissions, - Global economic growth wouldn’t be hindered by aggressive action to curb emissions.
While the GDP is projected to shortly dip mid-century with climate policies enacted, most research suggests that the economic benefits of limiting warming outweighs the cost of mitigation, - Wealthy countries will need to aid low-income countries financially to address inequities in vulnerability to climate change and to speed up the clean-energy transition in a way that benefits all.
Nations with the lowest amounts of greenhouse gas emissions are often those who are the most affected: the 88 countries that compromise the Least Developed Countries and Island Developing States are collectively responsible for 1% of historical carbon emission.
When someone still asks why we should act quickly, tell them what they would prefer:
Sophisticated actions now which costs can be easier calculcated with a fair distribution of burdens, or inaction that leads to an unknown amount of costs and burdens in the future with more severe damage to infrastructure, property and public goods?
There’s more uncertainty in a future where inaction and complacency rule than in a future where a transformation takes place in all sectors and in society as a whole which have already begun. And it will benefit everyone too, as we have seen. It can even reduce one’s electricity bill! The standard of living we enjoy in fully economic developed countries can exist everywhere else too, and we don’t even need to go to another planet.
Source
IPCC’s starkest message yet: extreme steps needed to avert climate disaster (paywall)
https://www.nature.com/articles/d41586-022-00951-5
Further Thoughts
Well, I wouldn’t be Baroque if I didn’t think about philosophy and ethics on such an important and broad topic. But I will keep it short, very short. It is about Climate Justice, a term you’ve likely heard about by now. I recommend the following read, and while it refers to the Fifth Assessment Report of the IPCC the content is still relevant: https://plato.stanford.edu/entries/justice-climate/
I consider myself a climate integrationist, meaning that I view climate change ‚in light of a general theory of justice and in conjunction with other issues‘. The issues include poverty, migration, trade, culture, and so forth. In contrast, isolationist treat the ethical issues posed by climate change in isolation from other issues like I have mentioned. In section 1 it is perfectly explained: „A second point that those who favour an Integrationist approach might make is that climate change is causally interconnected with a wide variety of other phenomena—such as economic growth, poverty reduction, migration, health, trade, natural resource ownership, and cultural rights—such that it is artificial to treat it on its own. Climate change does not present itself to us as a discrete problem that can be treated separately. Rather it is part and parcel of a larger process. It is an upshot of people’s activity (primarily through the use of energy) and, as such, it is causally intertwined with economic growth, poverty alleviation, urban design, and land use.“ It is more complex, but that way more detailed and taylored solutions can be found in cooperation with nations, both on a national and regional level.
On Intergenerational justice, I see myself in the egalitarian position. „Those who adopt an egalitarian perspective, for example, might think that current generations have a duty to act in such a way that they do not create stark inequalities within future generations […]. This is relevant in this context because climate change tends to exacerbate existing inequalities […].“
(Section 3.1) I personally want that humanity not just survives, but actually thrives.
What we do now to mitigate and adapt also benefits us, and it greatly benefits future generations who do not have to worry about food, water and stability. By tackling it together on various levels, from regional to national, it can also be a democratic revolution and entrench democratic values even deeper. Thus improving not only the standard of living, but also the quality of living. But I will elaborate on this philosophy in another article, for now it describes what I lacked the words for before.
Thank you for reading! Have a nice day!
