

In this entry, I introduce you to three scientific reports and summarize each one of them.
The first one is about microplastics in the Arctic Ocean, on the second place is a report on the larvae Protaetia brevitarsis seulensis and how it could be used as a future food source, lastly I’ll inform you about a spatial econometric analysis of China in regard to its forest industry and its effect on Co2-emissions.
All studies are Open Access and can be found on www.nature.com/scientificreports; no opinion is going to be added from my side. For those interested, I’m going to embed a link to each report at the beginning of each summary. The language is quite technical.
I’d recommend reading one nevertheless, since you are also going to learn about the structure of a scientific report and the background work it requires.
Note: 3SRS-1 stans for 3 Scientific Reports Summarized – Nr. 1

Image by Foundry (Pixabay)
Scientific Report Nr. 1: Microplastics in sea ice and seawater beneath ice floes from the Arctic Ocean
Published: 19th March, 2020
Authors: La Daana K. Kanhai, Katarina Gardfeldt, Thomas Krumpen, Richard C. Thompson & Ian O’Connor
Article Number: 5004 (2020)
Link: https://www.nature.com/articles/s41598-020-61948-6
Method of Research
Sample Collection: This study was conducted onboard the Swedish icebreaker Oden.
The expedition started on August 8th 2016 and ended on September 19th 2016.
At 25 ice stations, the sea ice cores (n = 25) were retrieved and seawater (n = 22*) was pumped from beneath the ice and filtered onsite for microplastics.
For the extraction of the ice cores, the team used a Nordic ice drill with an attached Husqvarna X-series 326A125 motor and a stainless-steel core barrel of 12.5 cm diamater.
Each time, the goal was to penetrate the ice by drilling and reach the underlying seawater.
On each site a single ice core (n = 1) was retrieved, placed into a clean bag (polyethylene) and transported to the laboratory onboard the ship for further processing.
*Due to incomplete penetration of the ice floe, the seawater could not be pumped from beneath the ice. That accounts only for 3 of the 25 ice stations.
Laboratory Processing and Analyses: By using a boomerang scraper, the outer surface of each ice core was scraped off. Then, a stainless-steel hand saw was used to cut each ice core into 10 cm vertical subsections. Each subsection was placed into individual clean Ziploc bags (polyethylene) and allowed to melt for 24-48 hours. Once melted, the water from each subsection was moved to a graduated cyliner and its volume measured.
Samples that produced spectra with a match <60% were automatically rejected. Those above the remaining spectra (>60%) were individually examined.
All in all, matches with >70% similarity were accepted while some between 60-70% similarity were also accepted.
Method Validation and Contamination Prevention: In order to minimize contamination of samples, several measures were taken. The wording is unchanged from the original.
In the field (samples):
(i) microplastic sampling was conducted upwind of all other activities
(ii) nitrile gloves were used when handling ice cores
(iii) the manual pump used at the ice stations was flushed with water prior to pumping seawater
(iv) stainless steel sieve that was used at the ice stations had a wooden cover affixed to it during filtration
In the lab (analyses):
(i) ice processing was conducted on a wooden surface
(ii) the wooden work area was washed down with MilliQ water in between processing of individual ice core subsections
(iii) all equipment (scraper, saw) was washed with MilliQ water
(iv) lab coats, cotton clothing and gloves were worn during sample processing
(v) all containers used during sample processing were cleaned using MilliQ water
Checks were also conducted to determine whether there was any contamination during sample processing.
Results
A quality control was also here in place to ensure that the ice cores weren’t contaminated.
This was done through a blank correction, that means the removal of a single fibre from each subsection. Thus avoiding contamination that might have been introduced by processing. In addition to it, any matches between synthetic polymers in the samples and those that came into contact with the samples were excluded from the results.
Microplastic Contamination in Sea Ice Cores: From the 25 ice cores, a total of 2,031 particles were isolated and analysed using FT-IR spectroscopy. 24.67% (501 particles) were rejected due to following reasons:
I) poor spectral matches
II) matches with polymers used during sample collection or processing
III) identification as being natural or semi-synthetic polymers
117 more were rejected from further analysis for being in the category of macroplastics
(>5 mm). Moving on to the 1,413 that were confirmed to be synthetic polymers.
223 were removed during the blank correction process. Consequently, the subsequent analysis was based on the 1,190 synthetic polymers from the sea ice cores.
> The majority had microplastic concentrations <8 particles (Fig. 1)
> 79% were fibres and 21% fragments
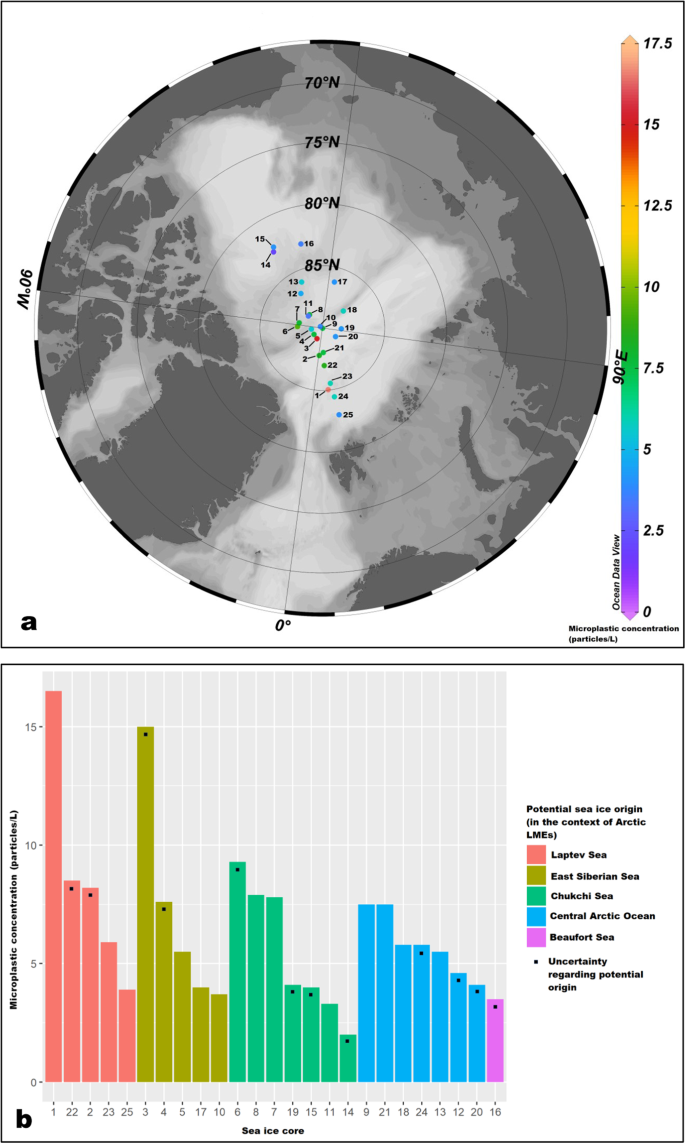
Vertical Distribution of Microplastics in Sea Ice Cores: There appears to be neither a consistent pattern in the vertical distribution of microplastics within sea ice cores nor an overall correlation between sub-section depth of the ice core and microplastic concentration. However, it was shown that microplastics are present throughout the majority of ice cores. Only in 4% of all ice cores, no microplastics were found.
Potential Origin of Sea Ice: Through backward trajectories, the ice could possibly have originated from the following places:
1) Laptev Sea and East Siberian Sea
2) Western Arctic (Baufort Sea and Chukchi Sea)
3) Central Arctic Ocean
Microplastics in Seawater beneath Ice Floes: From the surface water beneath ice floes, a total of 189 particles were isolated. 33.86% (64 particles) were rejected for the reasons already mentioned above. It was found that microplastic occurence beneath sea ice floes are orders of magnitude lower than those reported for sea ice (2×10³ vs 1.7×10⁴).
In 22 sites surface water was sampled, only on one no microplastic was detected.
Discussion
The findings in this study confirm those of previous studies: microplastic concentration in sea ice are magnitudes higher than those reported for seawater beneath ice floes.
Contrary to the concentration in Arctic sea ice where it has been underestimated. And while previous studies reported the highest microplastic concentrations thus far in sea ice, fibres were excluded from the analysis. By excluding fibres or particles <100 μm, microplastic concentrations in sea ice will be underestimated. This study included them and found that fibrous microplastic is with 79% dominant in the sea ice of the Arctic Ocean. On the other hand, the present and previous study showed no consistent pattern in the vertical distribution of microplastics within sea ice cores.
For investigators, studies that identify microplastic type and polymer composition provide insight about the potential sources of microplastics in the environment. 9 different types of synthetic polymer in the sea ice cores and 3 in surface waters were reported in the present study. The majority were compromised of fibrous polyester (57% sea ice cores, 70% surface waters) and polyamides (19% sea ice cores, 23% surface water).
While definite statements cannot be made about the origin of microplastics in surface waters or sea ice, there are four potential sources:
I) riverine discharge from the Siberian and Canadian rivers
II) influx of contaminated Pacific and Atlantic waters
III) grey water discharge from vessels operating in the Arctic
IV) atmospheric deposition
Regarding the backtracking, the results must be interpreted with caution. As it is pointed out: „there was a significant mismatch (>75%) between field and model-predicted ice thickness for 10 of the 25 ice cores. These mismatches could have been influenced by the fact that the algorithm used for tracking reconstructs the movement and evolution of sea ice that is mainly found in the Arctic Ocean, but doesn’t resolve dynamics and formation of new ice in leads“.
Conclusive statements about differences in the reported microplastic abundances cannot be made either, though it is plausible that sea ice functions as a secondary source of microplastics in the central Arctic and contributes higher microplastic abundances.
Atmospheric deposition of microplastic suggests that these particles can be transported through the atmosphere to even remote areas. Through winds in the Arctic region, said particles can then be deposited either unto ice floes during transport or directly unto surface waters.
Presently, it remains uncertain how microplastic affects marine organisms which habitate the sea ice is and whether it poses a threat. In the Arctic Ocean, the dominant under-ice fauna are the gammarid amphipod and the sub-ice fauna includes various species of copepods and fish such as the polar cod and Arctic cod. Microplastic fragments were found in the stomachs and digestive tracts of polar cod.
It is important to understand the presence, sources, transport, pathways and fate of microplastics in the Arctic Ocean to determine the potential threats posed by such containments to marine organism that inhabit or depend upon different environmental compartments in this ecosystem.
Scientific Report Nr. 2: Life cycle assessment of edible insects (Protaetia brevitarsis seulensis larvae) as a future protein and fat source
Published: 7th July, 2021
Authors: Amin Nikkah, Sam Van Haute, Vesna Jovanovic, Heejung Jung, Jo Dewulf, Tanja Cirkovic Velickovic & Sami Ghnimi
Article Number: 14030 (2021)
Link: https://www.nature.com/articles/s41598-021-93284-8
Method of Research (Materials and methods)
In figure 4, the life cycle assessment procedure of PBS (Protaetia brevitarsis seulensis) production can be seen.

The LCA (Life Cycle Assessment) is a strong and standardized methodology, hence it was used to conduct the environmental consequences of edible insect as a future protein source. IMPACT 2002+ was employed as the baseline impact assessment methodology.
IMPACT 2002+ divides the 15 impact categories into four damage categories (as depicted in the image above, these are: climate change, resources, human health and ecosystem quality).
Insect Production Sytem: In South Korea at Gwangmyeong-si, the study was conducted. It is located in the Mid-West region of Gyeonggi and a metropolitan area.


The insect species that was investigated is PBS larvea. It is one of the five species which are consumed in South Korea. Mushroom waste is used to feed insects and banana waste to feed immature insects. Throughout the year, the temperature is kept at 25 °C. The humidity, however, was not managed during the process. Lastly, the volume of the breeding box was 36 Liters (600 mm x 450 mm x 200 mm). On average, 7 eggs were laid by the investigated species every 7 to 10 days.
PBS has four life stages: i) egg, ii) larva, iii) pupa and iv) adult. For an egg to become a larva, it takes 10 weeks and is then ready to be collected. The farm that was investigated is a small insect farm with the capacity of 960 Kg larvae (dry basis) production per year.
Inventory Analysis: In this table, the main primary inventory data for small-scale edible insect production is depicted.

The emissions that occured within the composting process were included as production on-site emissions (see above), and the bio-waste treatment was considered as an avoided product.
Sample Preperation: The dried PBS larvae were collected from the insect farm located in Gwangmyeong-si. By using mortal and a pestle the dried sample was homogenized, then stored in a plastic box at -20 °C until further analysis.
Determination of Protein and Fat Content: The standard methods were used to determine the fat and protein content of PBS larvea. Nitrogen proteins were investigated by the Kjeldahl method.
If you want to know about the exact procedure about the fatty acid methyl esters preperation, as well as the analysis and identification of fatty acids, you can find it on p. 8 of the paper linked at the beginning of the scientific report nr. 2 section.
Background
It is explained by the authors that many studies have shown the impacts of common food production (e.g. beef, soybean) to be environmentally inefficient and the existing production systems of protein sources have „enornmous environmental disadvantages“ (p. 2).
A solution to for two problems are the insects, since they would address both the increasing demand for food and waste management by composting food waste.
At this point in time, around 2,000 insect species are consumed as food around the world.
In Europe, nine different species are currently recorded as being farmed for feed or food production. Worlwide, two billion people eat insects and are consumed as food in about 80 countries. South Korea is also among them. From 2011 to 2015, the value of the edible insect market has increased from 143 million to 259 million.
Most insect producers in Thailand are small and medium size companies which require relatively low land usage and capital investment. Environmental issues are a major factor with regard to the sustainable development of food production systems, consequently the study at hand applied Life Cycle Assessment (LCA) to estiminate the environmental impact.
Results and Discussion
The dried PBS larvae had a protein content of 50.5% and a fat content of 13.5%, the results of previous studies align with it. Its protein contents is similar to that of beef, pork and chicken, but it contains more polyunsaturated fatty acid (aka polyunsaturated fats; it is one of the healthy fats to which monounsaturated count too. It can be found in salmon, vegetable oils and other plant and animal foods as well) with higher contents of minerals such as zinc and iron.
18 fatty acids (FA) were identified: 6 of them were saturated FAs, 4 were polyunsaturated FAs and 8 were methyl FAs. Monounsaturated fatty acids (MUFA) contributed 71.70% to the total FA content. As mentioned above, it is one of the healthy fats and MUFAs are known for promoting a healthy blood lipid profile and improve blood pressure, insulin sensitivity, and glycemic control. With the data that was collected, the conclusion has been made that PBS larvea fed with banana waste can be used as a potential source of protein and fat.
LCA Results: The edible insect production system is beneficial to the environment on certain ICs, such as land occupation, mineral extraction, aquatic and terrestial ecotoxicity.
Due to the utilization of bio-waste (e.g. mushroom waste and banana peels) to feed insects, something harmful for the environment can be turned into compost. Previous studies have shown that common food production has negative effects on all investigated ICs (e.g. ozone layer depletion, global warming, aquadtic acidification).
Next to the PBS larvae, other insect species such as the Hermetia illucens and Tenebrio molitor have shown a promising potential to be used as an alternative for animal and plant-based lipids products like butter and margarine. Back to PBS larvae: The global warming potential of 1 kg protein from PBS insects (15.93 KgCo2eq) was lower than those of conventional meat (chicken with 18-36 kgCo2eq, pork with 21-53 kgCo2eq and beef with 75-170 kgCo2eq).

Another strong contrast is the usage of biomass: only 40-50% of the produced biomass of cattle, poultry and pigs are used directly as food. Whereas by insects, the whole body can be used. Furthermore, next to the environmental benefits of edible insects as mini-livestock they also have a smiliar nutritional quality as conventional livestock.
While edible insects have the potential to be future food, it should be noted that there are still safety concerns associated with the consumption of insects, namely the microbiological and chemical health risk. The study at hand investigated the environmental impacts, the chemical and microbiological health risk is not part of the LCA.
Consequently, further research is needed to look at those health risks to move towards a sustainable edible insect-based production system.
Conclusions
Many common food production systems are not sustainable, hence this study to investigate the life cycle of small-scale PBS production was conducted. In 4 out of 15 investigated impact categories, the PBS edible insect production has a positive environmental impact.
However, there were still negative environmental impacts observed in other categories.
The global warming potential, for instance, ranged for 1 kg of insects by 8.05 kgCo2eq to 12.52 kgCO2eq based on the application of different impact assessment metholodogies.
Lastly, the environmental efficiency can still be increased by managing certain inputs, such as electricity.
Scientific Report Nr. 3: The effect of total factor productivity of forestry industry on Co2 emissions: a spatial econometic analysis of China
Published: 9th July, 2021
Authors: Shen Zhong & Hongli Wang
Article Number: 14200 (2021)
Link: https://www.nature.com/articles/s41598-021–93770-z
Method of Research
The last scientific report includes a lot of formulas. For those who are interested in the specifics, I have added the page number as well. I will, however, describe for what the formulas were used for in the study (as it was described there as well).


Malmquist Index: The formulas here are used to measure productivity changes in a period.
Global-Malmquist Index: An advanced version of the Malmquist index. The definition of the production probability has been improved.
Spatial Autocorrelation Test: A series of methods to measure spatial correlation.
(6) Moran Index I, (7) Geary Index C and (8) Local Moran’s Index.
Spatial Panel Model: In spatial economics it is suggested, that there is a spatial correlation between things (i.e. every thing is not an independent individual). There are three spatial econometric models in this paper, which are as followed:
(9 & 10) Spatial Error Model (SEM), (11) Spatial Autoregressive Model (SAR) and (12) Spatial Durbin Model (SDM).
Direct Effect, Indirect Effect and Total Effect: The three effects are described as followed in the paper: „The direct effect refers to the influence of the change of the explanatory variable on the explained variable in the local region; the indirect effect, also called the spillover effect, measures the degree of the influence of the change of the explanatory variable in the local region on the explained variable in other regions, and the total effect is the sum of direct and indirect effect“ (p. IV). In this paper, the influence of TFP on Co2-emissions was measured.
Lastly, the specific calculation of the three aspects is based on the spatial Dubin model.
Dependent Variable: This is the formula to calculate the carbon emissions of 8 energy energy consumption (coal, coke, crude oil, gasoline, kerosene, diesel, natural gas and fuel oil) in 30 provinces of China from 2006 to 2016.
Independent Variable: Since this paper not only includes human input and capital input, but also natural resource elements to the input indicators, the authors decided to use the perpetual inventory method to calculate the forestry capital stock.
Furthermore, the paper also measures the total output value of forestry primary, secondary and tertiray industries (e.g. agriculture, animal husbandry, social service industries).
The forst stock volume represents next to the total scale and level of forest resources in a region, also the abundance of forest resources and provides a basic indicator of the quality of the forest ecological environment. Hence, forest stock is used as one of the output indicators.
Control Variables: The following variables have been added due to their importance and representative nature:
Per Capita GDP (HGDP) – used to measure overall level of regional economic activities,
Per Capita Foreign Direct Investment (FDI) – includes explanation of „pollution haven hypothesis“ by Walter & Ugelow, as well as the „pollution halo hypothesis“
Technology Market Turnover (VOL) – in regard to energy-saving and emission-reduction,
and Urbanization Level (URB) – due to increase in Co2-emissions and service efficiency of public resources.
Data Source: 30 provinces from mainland China between 2005-2016 were taken. The data comes from the „China Statistical Yearbook“, „China Environmental Statistical Yearbook“, „China Forestry Statistical Yearbook“ and „China Energy Statistical Yearbook“.
All monetary indicators, as it is mentioned, are deflated through using the fixed assessment price index and consumer price index with 2000 as the base year.
Finally, to make the data more stable and to reduce the effect of hetereoscedasticity, they logarithmically treated the Co2, HGDP, FDI, URB and VOL in their paper.

Empirical Results
Spatial and Temporal Characteristics of the Co2 emissions distribution:
In the 30 provinces, the average Co2 emissions was 3.19 million tons from 2008-2017.
Of those, 9 provinces have exceeded the national average. The Shandong province reached the highest Co2 emissions with 1.18 million tons. Hainan and Qinghai had the lowest with less than 0.6 million tons. Table 4 for reference.

In figure 2 and 3, from a spatial point of view, there were significant differences in Co2 emissions in various regions. In the eastern region there was a significant increase in Co2 emissions from 2008-2012. Whereas the western and central region in China had a relatively slow growth in Co2 emissions due to its relatively stable economic development and population size. After 2012, there have been significant drops in Co2 emissions across the country. One possibility, as the authors point out, may be a shift of the focus from solely rapid economic growth to optimization of the industrial strcutre and promotion of economic development. Figure 2 and 3 for reference.
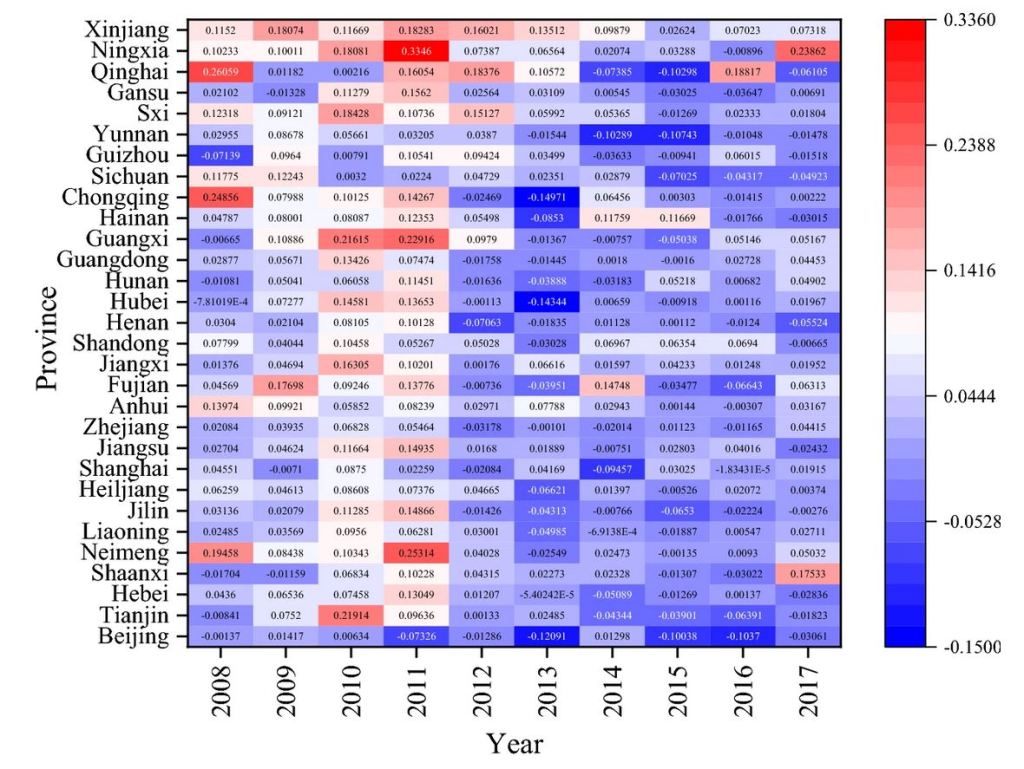

Analysis of TFP and its Decomposition Index: From 2008-2017 the overall level of TFP in China’s forestry industry isn’t high, the average being 0.996.
In 2008 it was the lowest with 0.992, then starts to rise after 2009 and reached its peak in 2010 at 1.009. It may have been affected by the global financial crisis in 2008.
In response to the financial crisis, domestic demand was expanded and the forest management system improved. Consequently, there was a rapid rebound after 2009.
From 2008-2017, the average TFP of forestry industry in half of China’s provinces was less than 1. In Shanghai, the annual growth rate was the largest and reached more than 6%.
Regarding technical efficiency change, Xinjiang had the highest growth rate with more than 3% and Heilongjian had a negative productivity rate. As it can be seen in figure 5, there are clear spatial differences in TFP and its decomposition index (EC, TC) of forestry in each province.

Results of Spatial Econometrics Analysis: The Global Moran’s I of each region was greater than 0, and the Geary’s Coefficient were less than 1. From the coefficient it can be observed that the spatial correlation gradually decreases with the passage of time.
Analysis of Spatial Panel Regression results: The impact of total factor productivity (TFP) of the forestry industry on Co2 emissions displayed an „inverted U-shaped“ curve. If one ignores the spatial effect of forestry industry, it would enlarge the impact and make the results inaccurate. And while urbanization increases the demand for housing and resources thus leading to a Co2 emission increase, the efficiency of public goods will also be increased which leads to a reduction of Co2 emission. For each 1% increase of the FDI, the authors say, the emission is decreased by 1%. Therefore showing that the „Pollution Haven Hypothesis“ does not fit the situation in China.
Sustainable development is, according to the authors, in China one of the important development goals. The attention moving more to quality and efficiency. Due to the vast territory (an area of 9,596,960 km²) and abundant resources, however, the economic development on carbon emission has not been fully reflected yet. In regard to technological innovation, China focuses more on production technology.
A more detailed overview can be found on page 12, as well as Benchmark regression analysis on page 9.

Analysis of Direct Effects, Indirect Effects and Total Effects of SDM: The impact of TFP of forestry industry on Co2 emissions, as it can be seen in table 9 below, is not a linear relationship but rather an „inverted U-shaped“ curve relationship.
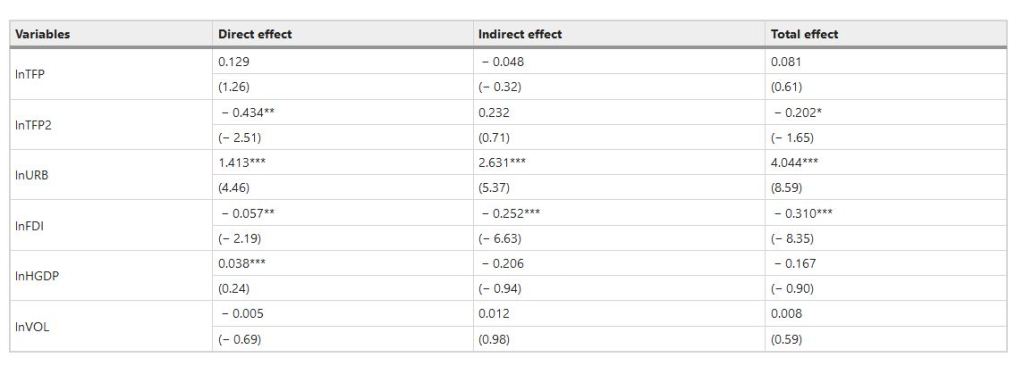
The three aspects in the urbanization levels are significantly positive at the 1% significance level, therefore indicating that urbanization significantly increases Co2 emissions in a region. Due to factors such as „bandwagon effect“ and „imitation effect“, there will also be an incresae in Co2 emissions in adjacent (neighbouring) areas. However, every 1% increase of the FDI (Foreign Direct Investment) level reduces Co2 emissions of this region by 5.7% and that of neighbouring regions by 25.2%. Said FDI, according to the authors, will undoubtedly help with reducing Co2 emissions and also drive FDI in neighbouring regions to identify „green“ companies and improve the environment of surrounding area.
Further Analysis: From 2008 to 2017, the average TFP of the forestry industry – taking unexpected output into account as well – is 1.007, nearly 0.010 higher than without the unexpected output.
A step by step method to explore the impact of total factor productivity, alongside new measurement results that serve as main explanatory variables, were used to avoid multicollinearity regression results. The authors note that except for the individual variables, the regression results are similar to the above.
What is a multicollinearity regression result? – From Statology
„Multicollinearity in regression analysis occurs when two or more predictor variables are highly correlated to each other, such that they do not provide unique or independent information in the regression model. If the degree of correlation is high enough between variables, it can cause problems when fitting and interpreting the regression model.
For example, suppose you run a regression analysis using the response variable max vertical jump and the following predictor variables:
– height
– shoe size
– hours spent practicing per day
In this case, height and shoe size are likely to be highly correlated with each other since taller people tend to have larger shoe sizes. This means that multicollinearity is likely to be a problem in this regression.“
Discussion
The authors observed an interesting phenomena, laid out in three points.
- From 2008 to 2017, the development of the forestry industry in China shifted from eastern China to the central and western region. Those areas with high efficiency of technological process (TC) are still mainly concentrated in Shanghai, Jiangsu, Fuzhou and other eastern regions.
- In regard to the effect of TFP on Co2 emissions in the forestry industry of China, an inverted U-shaped curve can be seen. At the early stage of the development of the forestry industry, a lot of manpower and material resources are required which subsequently lead to a rise in emissions. Once it has been fully developed, total factor productivity reaches 0.9395 and thus also effectively reduces Co2 emissions.
- A significant negative spillover effect was observed. Through a „warning effect“ under the strategic layout of sustainable development, those regions nearby to „negative cases“ formulate more strict environmental regulation policies and environmental governance measures.
The TFP improvement of forestry industry in neighbouring areas will increase Co2 emissions of the region which then require each region to develope an own sustainable strategy that is suitable for them instead of imitating their neighbours.
Conclusions and Implications
Forestry has a great impact on Co2 emissions. The paper at hand constructed the spatial econometric model to empirically study the impact of TFP of forestry industry on Co2 emissions from the spatial perspective. The direct, indirect and total effect were also analyzed. There are three major conclusions that were drawn of the study by the authors:
- From 2008 to 2017, the development of forest industry has gradually shifted from the eastern region to the central and western regions. This is reflected in the improvement of total factor productivity (TFP) and technical efficiency change (EC).
- There’s not a linear relationship in the impact of TFP of the forestry industry on Co2 emissions, instead it shows an „inverted U-shaped“ curve which inflection point is 0.9395.
China is now at the right side of the fixed point of the inverted U-shaped curve. - Due to the „warning effect“, the spatial spillover effect of Co2 emissions is significantly negative.
Foreign Direct Invesment, urbanization level, per capita GDP and technology market turnover are also going to affect regional Co2 emission.
The authors of the study also provide policy implications based on the conclusions above:
- Strengthen the management of forest resources.
Modern forestry technology needs to be effectively used to strengthen the protection and construction of ecological public welfare forests (e.g. water conversation forests). Simulatenously, it also needs to increase the cultivation of commercial forests to effectively increase the total amount of resources. Furthermore, minimizing the occurence of natural disasters such as forest degradation, diseases and insect pests is crucial. - Development of forestry biomass energy.
This can be achieved by cultivating energy forest species, strengthening the construction of energy forest to give full play to its important role in ecological protection and climate regulation by absorbing Co2. An industry chain with characteristics of energy forest cultivation and biomass energy processing integration are also part of it. Through that, the goal of a sustainable development of forestry can be achieved. - Optimization of forestry industrial structure and improve economic benefits.
A shift from the primary industry to the tertiary industry is crucial. That can be done by scientifically plan the development of tourism service industry in combination with the regional spatial characteristics and resource endowment – regarding it as a new economic growth point. For the secondary industry, there needs to be an increase in funds and disciplines to improve quality of scientific research personnel and their equipment, then turning these advantages into economic benefits.
Lastly, in order to strengthen the flow of resources between the different regions a forestry industry development mode of „rich with poor“ should be formed.
The development plan of each region should take into account its individual differences – that means the local conditions and their own characteristics of forestry production endowment. As well as strengthening the spatial interaction influence of forestry production.
End
And this is the end of the scientific report summary. It is the first time I have done it, and no, unfortunately I’m not a STEM-Student or about to become one. It is probably far from perfect, but I hope it it sufficient nevertheless. Summarizing these scientific reports was a good learning experience nevertheless. It took a whole month for me to realize this little project. Due to my not fully matured English language skills, which can be clearly observed throughout the summary while comparing it to the original, it will also take a long while until I do something like that again. For the time being, I stick to Science News on ScienceDaily and elsewhere.
Until next time, see you!
Addendum (2021-08-29, 11:47 pm)
I transformed my entry now into a PDF-file, should you be interested in downloading or even printing it. Overall, it is 33 pages long. I hope that it meets your quality standards.
