
The recently released IPCC report confirmed once more what a vast majority of scientists already have warned about for decades: human-made climate change.
From more droughts in drier regions to floods in wetter regions, sea level rising due to the melting of glaciers and polar ice caps and increased hot weather extremes such as heatwaves – it all boils down to the influence humanity has on the Earth’s climate.
In order to prevent the worst and mitigate the effects of said warming, we must act now.

The Facts
Without further ado, we shall go straight to the facts from the IPCC report AR6.
- There’s no doubt that human influence has warmed the atmosphere, ocean and land. In the biosphere, cryosphere (greek, krio = cold; examples: permafrost, glaciers), ocean and atmosphere widespread and rapid changes have occurred.
- The observed increase of ‚well-mixed greenhouse gas (GHG)‘ concentration since the 1750s is indisputably caused by human activies. Annual averages for carbon dioxide (Co2) have reached 410 ppm, 1866 ppb for methane (CH4) and 332 ppb for nitrous oxide (N2O) in 2019. Over the past 6 decades, the land and ocean have globally taken up about 56% per year. [ppm = parts per million, ppb = parts per billion]
- Human-caused global surface temperature is likely within the range of 0.8 C° to 1.3 C° from 1850-1900 to 2010-2019, the best estimate being 1.07 °C.
- In regard to the current acidification of the surface open ocean, it is virtually certain that it is caused by human-made Co2 emissions. The warming of the upper ocean (0-700 m) since the 1970s is also virtually certain and human activity being the main driver extremely likely.
(SPM-5 to SPM-6)
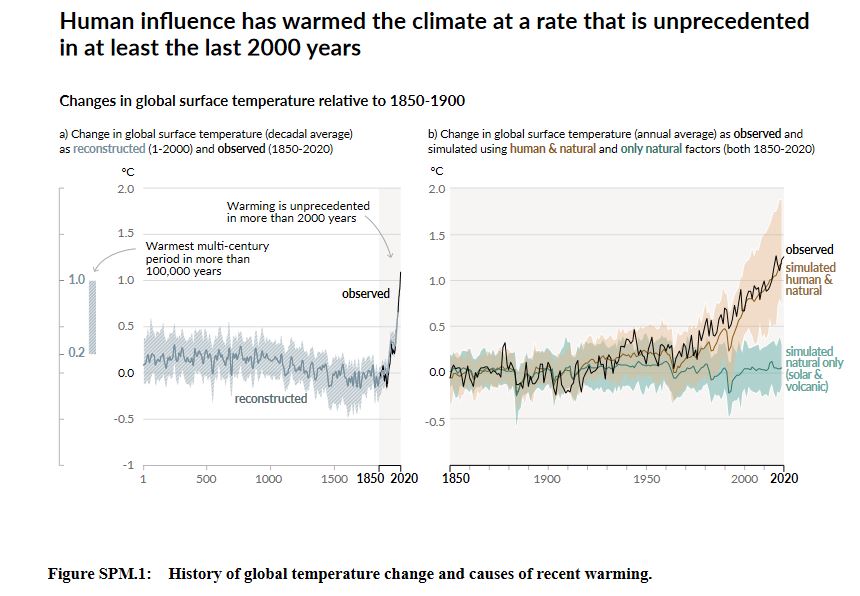
Panel a) shows the reconstructed global surface temperature from paleoclimate archives (1-2000) and from direct observations (1850-2020). On the left, a vertical grey bar is visible which shows the estimated temperature (very likely range) during the warmest multi-century period in at least 100,000 years (which occurred during the Holocene).
Panel b) displays the changes in global surface temperature over the past 170 years (black line). The brown line includes both human and natural drivers(CMIP6 climate model), whereas the green-blueish line only shows natural causes (e.g. volcanic activity).
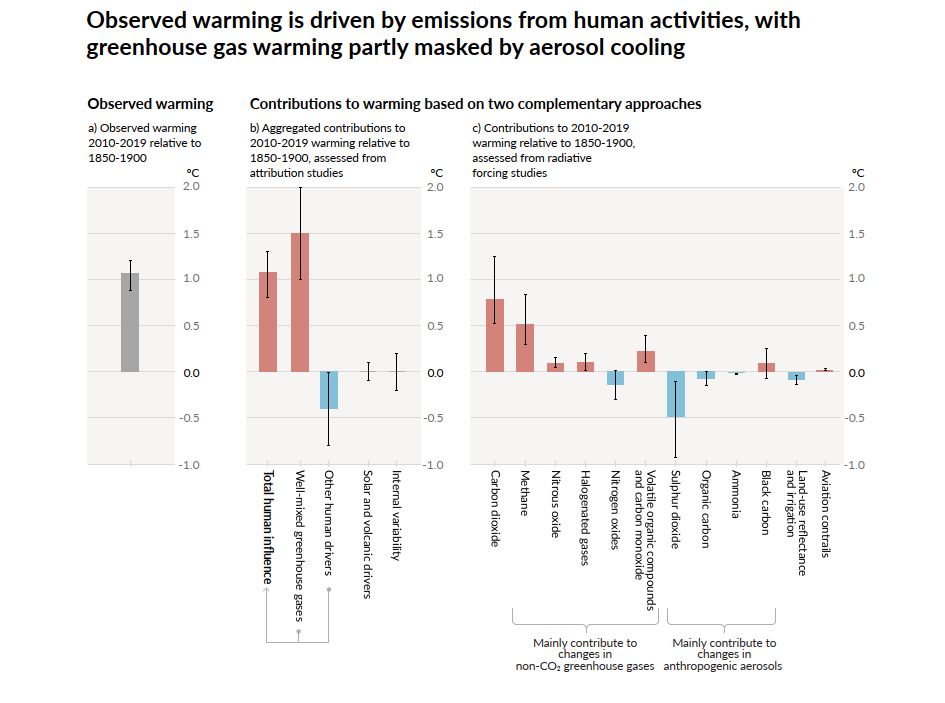
Panel a) shows the observed global warming and its very likely range.
Panel b) illustrates the evidence from attribution studies which synthesized information from climate models and observations (from human influences to natural drivers).
(Whiskers = likely ranges)
Panel c) displays the evidence from the assessment of radiative forcing and climate sensitivity. Both direct (radiation) and indirect (interactions with clouds) were accounted for by aerosols („Aerosols are minute particles suspended in the atmosphere. When these particles are sufficiently large, we notice their presence as they scatter and absorb sunlight. Their scattering of sunlight can reduce visibility (haze) and redden sunrises and sunsets.“ – NASA)
That’s not all, the changes in the climate system are unprecedented over many centuries to many thousands of years (as figure 1 has already shown).
- In 2019, the Co2-emissions in the atmosphere were higher than at any time in ~2 millon years (high confidence), the concentration of CH4 and N2O higher than in 800,000 years (very high confidence)
- The global sea level has increased faster between now and 1900 than over any preceding century in the last 3,000 years (high confidence).
- Hot extremes, such heatwaves, have become more frequent and more intense across most lands and regions since the 1950s (virtually certain), whereas cold extremes (e.g. cold waves) were observed to decrease in frequency and severity; with high confidence it can be said that human-induced climate change is the main driver of said changes
- Heavy precipitation that is associated with tropical cyclones is also attributed to man-made climate change (high confidence), though „data limitations inhibit clear detection of past trends on the global scale“ (SPM-11)
- Radiative forcing (human-caused) led to an accumulation of additional energy (heating) in the climate system, it was partially lost to space. 91% of the heating took place in the Ocean; land warming 5%, ice loss 3% and atmospheric warming 1% (high confidence)
- The dominant contributors to the rise of the global mean sea level during 2006-2018 were ice sheet and glacier mass loss (high confidence)
Before we continue with more facts, the IPCC report also included a new illustrative which depicts five possible climate futures. Each scenario starts in 2015 and is described as followed:
SSP3-7.0 & SSP5-8.5: High and Very High GHG (Greenhouse gases) emissions
SSP2-4.5: Intermediate GHG emissions and current Co2-emissions remaining until the middle of the century
SSP1-1.9 & SSP1-2.6: Very Low and Low GHG emissions and declining Co2-emissions to net zero around or after 2050, followed by varying levels of neg negative Co2-emissions
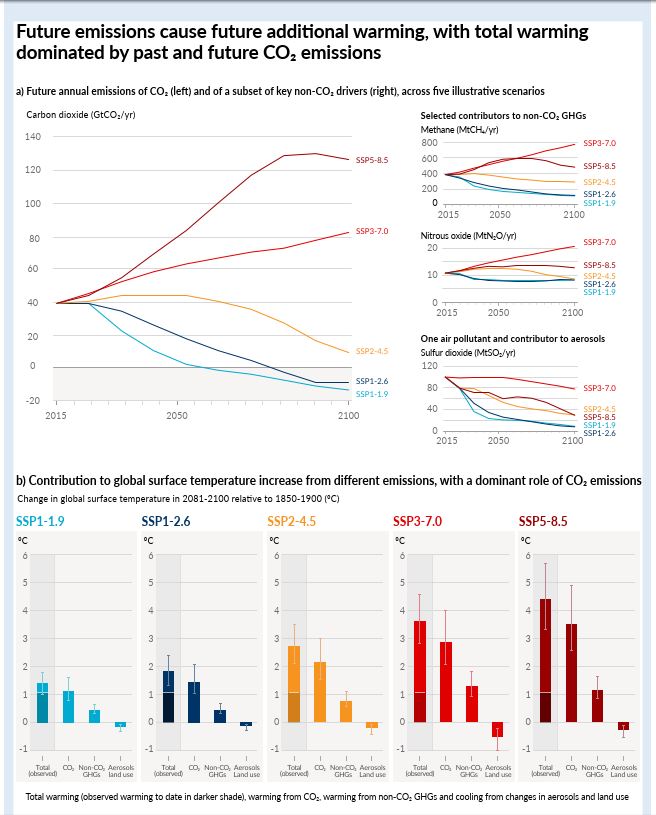
Panel a) illustrates the annual human-caused emissions over the 2015-2100 period. Next to Co2 trajectories from all sectors, there are three key non-Co2 drivers considered in the scenarios: methane (CH4, MtCH4/yr, top-right graph), nitrous oxide (N20, MtN2O/yr, middle-right graph) and sulfur dioxide (So2, MtSo2/y, bottom-right graph)
Panel b) shows the warming contributions by groups of anthropogenic (human) drivers and by scenario are shown as change in global surface temperature.
Due to the reduced size caused by the screenshot, it can be read from left to right in each graph: Total (observed) – Co2 – Non-Co2 GHGs – Aerosols land use
Each scenario also changes the outcome of the 2°C global warming line:
SSP5.-8.5: Very Likely to cross the 2°C global warming level mid-term (2041-2060)
SSP3.-7.0: Likely to cross the 2°C global warming level mid-term
SSP2-4.5: More Likely Than Not to cross the 2°C global warming level mid-term
SSP1-2.6: Unlikely to exceed 2°C global warming level mid-term
SSP1-1.9: Extremely Unlikely to exceed 2°C global warming mid-term
If you would like to know more about the five different scenarios, you can read about them from SPM-15 (page 15) to SPM-18 (page 18).
With that in mind and the knowledge that there still better futures possible, let’s move on.
- For each additional 0.5°C of global warming, there occurs a clearly discernible increase in intensity and frequency of hot extremes – like heatwaves – (very likely), heavy participation (high confidence) and agricultural & ecological droughts in some regions (high confidence)
- The South American Monsoon regions, as well as some mid-latitude and semi-arid regions, may see the highest increase in the temperature of the hottest days with 1.5 to 2 times the rate of global warming (high confidence). Moreover, the frequency of marine heatwaves will continue to increase as well (high confidence)
- Globally, extreme daily precipitation events are projected to intensify by ~7% for each 1°C of global warming (high confidence). Intense tropical cyclones (categories 4-5) and peak wind speeds of themost intense tropical cyclones will increase with increasing global warming (high confidence)
- Permafrost thawing is also projected to amplify with additional warming, as well as loss of seasonal snow cover of land ice and of Artic sea ice (high confidence)
The next two graphics show the impact global warming has had and is going to have regarding the warming around the globe and the change in dryness and wettness depending on the severity of global warming.
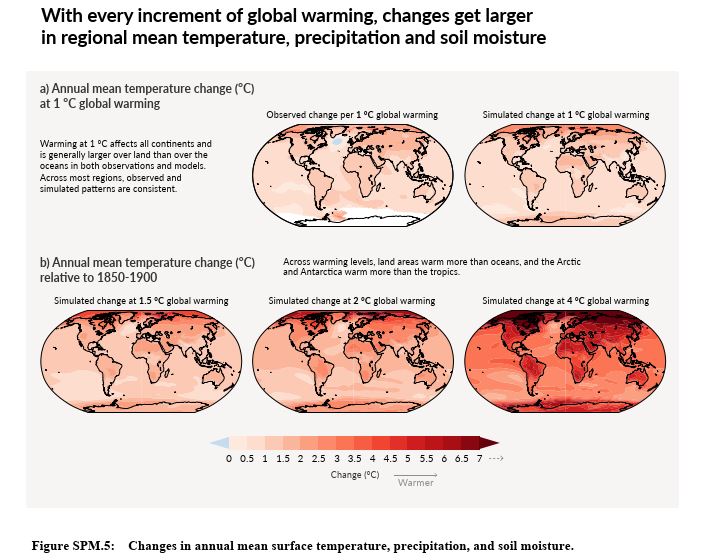
Panel a) compares the observed change (1850-2020) and simulated change.
Panel b) shows the simulated mean temperature change in °C
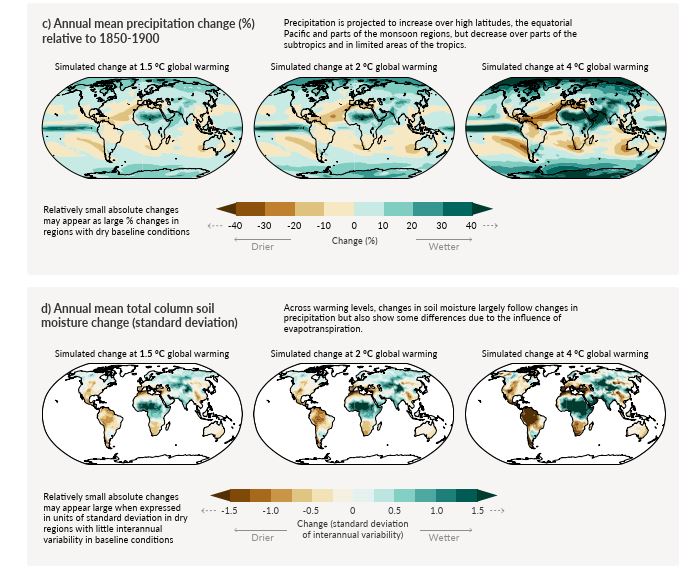
Panel c) displays the precipitation change relative to 1850-1900
Panel d) shows the total column soil moisture change
Figure 6 on page 24 shows the projected changes for hot temperature extremes over land, heavy precipitation over land and Agricultural & ecological drought in drying regions.
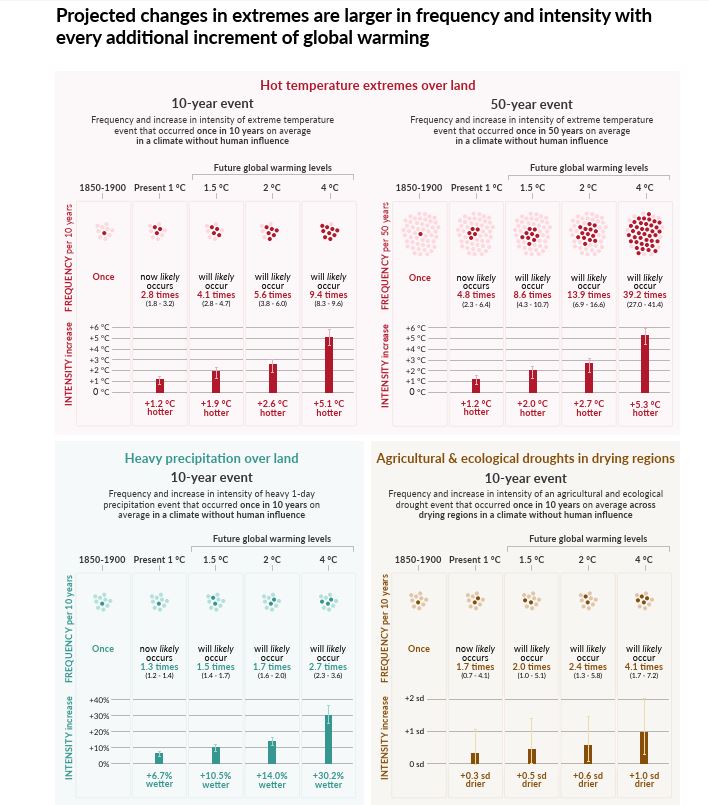
The frequency section displays each year as a dot. The dark dots indicate years in which the extreme threshold is exceeded, whereas light dots indicate the opposite.
The intensity section displays medians and their 5-95% range, dark and light having the same meaning.
Definitions:
Hot temperature extremes: Once in a decade, the daily maximum temperatures over land were exceeded (10 years) or once in five decades (50-years) during the 1850-1900 reference period.
Extreme precipitation events: As it is with hot temperature extremes, it means exceeding the daily precipitation amount over land on average in a 10-year period (1850-1900 being the reference period).
Agricultural and ecological droughts events: the annual average of total column soil moisture below the 10th percentile of the 1850-1900 base period (SPM-24).
The following regions are included at 2°C warming: W. North-America, C. North-South-American-Monsoon, S.W. South-America, S. South-America, West & Central-Europe, Mediterranean, W. Southern-Africa, E. Southern-Africa, Madagascar, E. Australia and S. Australia. Region that are non-drying do not show an overall increase or decrease in drought severity.
As the graphs have already shown, continued global warming is projected to further intensify the global water cycle and with it its variability. The severity of wet and dry events are impacted as well.
- „There is high confidence in an earlier onset of spring snowmelt, with higher peak flows at the expense of summer flows in snow-dominated regions globally“ (SPM-25)
- „A warmer climate will intensify very wet and very dry weather and climate events and seasons, with implications for flooding our drought (high confidence)“, however, the location and frequency depends on factors like regional atmospheric circulation.
- Rainfally variability related to the El-Nino-Southern Oscillation is also projected to be amplified by the second half of the 21st century (around 2050) in the SSP2-4.5, SSP3-7.0 and SSP5-8.5 scenarios (very likely)
Depending on the scenario (the five I presented earlier in this entry), the emissions taken in by land, ocean and the atmosphere can differ greatly. Shown in the following graph:
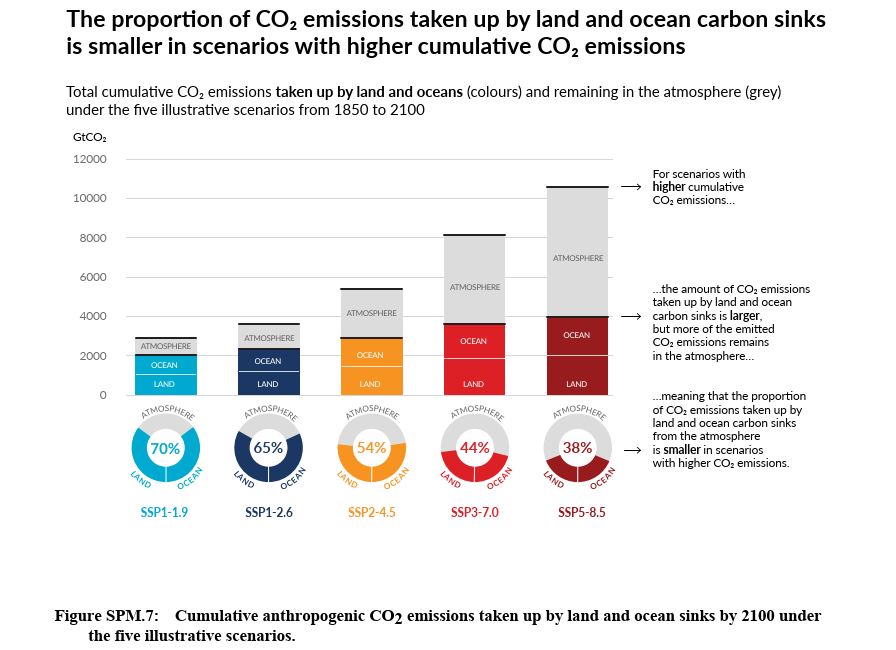
The bar chart illustrates the projected amount of increasing human-caused Co2-emissions between 1850-2100; grey shows what remains in the atmosphere and the coloured sections what remains in the ocean and on land.
The doughnut chart shows the proportion of Co2-emissions remaining in the atmosphere, land and oceans.
A lot of the changes that occurred or will occure due to past and future greenhouse gas emissions are irreversible for centuries to millennia, especially changes in the ocean, ice sheets and global sea level.
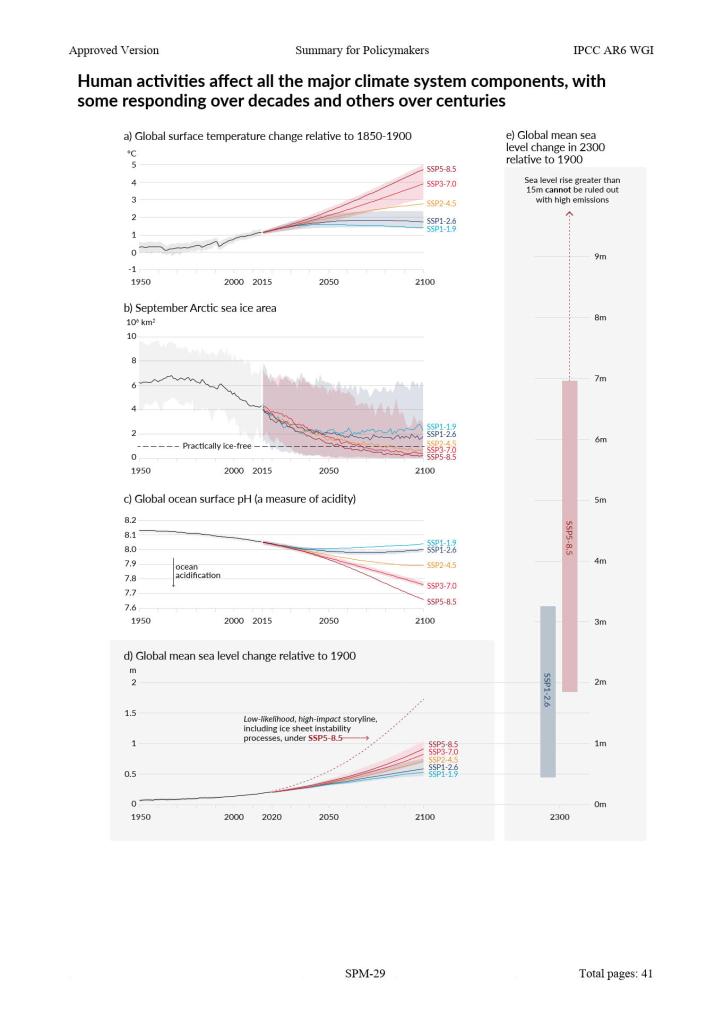
- „Based on multiple lines of evidence, upper ocean stratification (virtually certain), ocean acidification (virtually certain) and ocean deoxygenation (high confidence) will continue to increase in the 21st century, at rates dependent on future emissions“
- Glaciers in the polar regions and mountains are going to continue melting for decades or centuries (very high confidence). Continued ice loss over the 21st century for the Greenland Ice Sheet is virtually certain, while it is likely for Antarctic Ice Sheet.
- „It is virtually certain that global mean sea level will continue to rise over the 21st century“
Depending on the scenario, relative to 1995-2014, the sea rise may increase as follows:
SSP1-1.9 – 0.28-0.55 m (very low GHG emissions scenario)
SSP1-2.6 – 0.32-0.62 m (low GHG emissions scenario)
SSP2-4.5 – 0.44-0.76 m (intermediate GHG emissions scenario)
SSP5-8.5 – 0.63-1.01 m (very high GHG emissions scenario) - „In the longer term, sea level is committed to rise for centuries to millennial due to continuing deep ocean warming and ice sheet melt, and will remain elevated for thousands of years (high confidence)“. The projections are consistent with the reconstructed levels during past climate period.
In order to avoid an information overload, I’ll now end it with excerpts from C. Climate Information for Risk Assessment and Regional Adaptations (SPM-31 to SPM-36)
- While volcanic activities have partially masked human-caused surface global warming during 1998-2012 (high confidence), the warming of the climate system continued during this period as it is reflected in both the continued warming of global ocean (very high confidence) and in the ongoing rise of hot extremes over land (medium confidence)
- „Near-term cooling at any particular location with respect to present climate could occur and would be consistent with the global surface temperature increase due to human influence (high confidence)“
- The evidence of paleoclimate and history suggests that at least one large explosive volcanic erruption would occur during the 21st century (likely). Should such an eruption occur, it would consequently temporarily and partially mask human-caused climate change.
- „All regions are projected to experience further increase in hot climatic impact-drivers (CIDs, see figure 9 SPM-34) and decreases in cold CIDs (high confidence)“ […] „These changes would be larger at 2°C global warming or above than at 1.5°C (high confidence. For example, extreme heat thresholds relevant to agriculture and health are projected to be exceeded more frequently at higher global warming levels (high confidence)“ (SPM-32)
- „It is virtually certain that regional mean relative sea level rise will continue throughout the 21st century, except in a few regions with substantial geologic land uplift rates.“ Because of the sea level rise, extreme sea levels event that have occurred once per century in the recent past are projected to occur at least annually at more than half of all tide gauge locations by 2100 (high confidence)
- In cities, human-induced warming is intensified locally and further urbanization along with more frequent hot extremes will increase the severity of heatwaves (very high confidence). The combination of more frequent extreme sea level events and extreme rainfall/riverflow will make flooding more probably in coastal cities (high confidence)
(SPM-33)
As I stated earlier, I could go on with the list, but unlike other scientific papers I have summarized, the overview you’ve got now is hopefully enough to get the whole picture of the magnitude of change that global warming has already caused and could cause depending on the scenario. For those already more well-read into the topic, I hope I could provide information you didn’t know about yet.
The following website of the IPCC also includes a fact sheet for regional impacts:
https://www.ipcc.ch/report/ar6/wg1/
Conclusion
There’s no doubt about it that we must act immediately and with great intensity, thoroughly. Our response must be organized and continuous, not only in form of protests but also in information distribution and direct-influence by encouraging and supporting candidates and parties who fight for more environmental protection and awareness.
It can only be dealt with efficiently and effectively, if the vast majority is onboard with the facts and aware about the danger which comes from inaction. While it cannot be stopped, there’s still the chance of mitigating it and, perhaps, even reach the low or very low GHG emission scenario. If there’s enough political will and participation, it is possible.
I will introduce some of the approaches I already have in mind and which can be expanded upon or improved.
Strategies
- Green Infrastructure. In order to decrease the Co2-emissions, public transport should receive strong investments and extended where necessary. Primarily in cities to reduce the amount of traffic and parkings lot as well, a positive side effect is a more family-friendly city. Former parking lots can be turned into living areas, parks, or recreational facilities (e.g. sport facility for youth and adults). Moreover, by building bycicle lines a structure is created that incentives people to use it and thus reduce the carbon dioxide emissions as well. Another benefit of the green infrastructure is a healthier air quality could even lead to a drastic reduction of deaths that are partially caused by pollution.
The air traffic within a country can be replaced by airships (Zeppelin), while they may be slower than conventional aircrafts they are also environmentally friendly and quiet.
Additionally, they also have the benefit of a more relaxed travelling and are more spacious than an airplane – plus the view while you fly from one place to another. - Environmental regulations and waste infrastructure. A more classic approach are environmental regulations. These should also be abided by in developing countries, especially when it comes to multinational companies that are located in first-world countries. They have the means and technology to reduce their footprint, therefore they are also required to focus on an environmental objective. Meanwhile, the modern western nations can provide support through knowledge and international aid to build up a waste infrastructure. Thus also reducing the amount of plastic that ends up in the ocean. Of course, the difference between large corporations and medium-sized/small ones are essential. The latter cannot afford the technology and capital that is required to fulfill some regulations. Naturally, they must be tailored to their capabilities.
- Co2-Capture technology. Existing carbon dioxide in the atmosphere should be captured and stored. It is probably unlikely to achieve the low and very low GHG emission scenario otherwise. Therefore, investing in said technology is beneficial if our goal is to aim for the best-case scenarios of the five possibilities.
- Renewable energies and nuclear energy. Another classic approach, if you will. There’s no doubt that subsidizing renewable energies has led to a wider availability and thus also decreasing the costs to acquire them. Not all renewable energies are the same, some impact their surroundings more than the others. Therefore, by assessing each in the location and environment they are planned to be build in, the efficency and environmental impact can be determined (which is already done with wind turbines).
Solar panels, on the other hand, can be put on roof tops and provide energy this way. It would reduce the footprint of a household and reduce the demand for conventional energy the way it is produced and distributed as of now.
One cannot deny the efficency and climate neutrality of nuclear energy either. For a radical change, I consider it to be essential for a successful transformation of the energy sector. They are much safer now and, perhaps, even immune to a total failure (e.g. molten salt reactors). It is important to see them as complementary technology, not rivaling the renewable energies. By decreasing the cost for electricity near a nuclear power plant, the real estate and property price remains more intact. Additionally, the improved safety and strict controlls ensure overall security. A committee that takes this at heart could even be created, if necessary. - United Climate Front (UCF). As stated previously, we must also combat misinformation. By exchanging regularly with the scientific community (especially climate sciences) and making the information easily accessible and understandable, the disinformation can be comatted more effectively. The benefits of climate actions should be a key aspect, and of course, an open discourse with the factual information in mind to have constructive discussions both policy-wise and for the people to have a clear picture (why is policy X needed? what does party Y do to combat issue X affected by climate change? etc.). Environmental and climate awareness are a necessity, and they should be spread with a clear strategy in mind. Depending on the country, the strategies may change while the core messages stay the same. For instance, native plants should remain on native soil to prevent unwanted changes in the ecosystem of another country. The measurements should therefore always include the natives and take the biodiversity into account.
There are more approaches, of course, but to keep it short I presented five. As always, constructive criticism and discussions are welcome! It is a big task, after all.
Many people are already working on it, and there’s a lot of work that needs to be done.

NOW! The time to act is now on climate change!
LikeLike